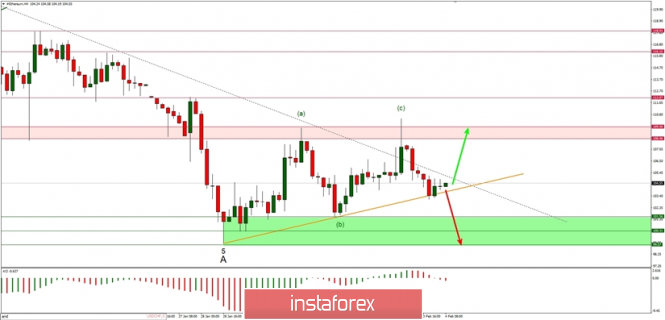
Ethereum Elliott Wave analysis for 04/02/2019:
Wave (c) was completed, downtrend to resume?
Market technical overview:
The ETH/USD market has completed the wave (c) to the upside with a top at the level of $110.26. The technical resistance zone located between the level of $108.46 - $109.50 is still a tough nut to crack for the bulls and the bears are still pushing the price down every time it gets there. This is why it is a key resistance for the bulls and the fight for it will continue. On the way down the market has made a local low at the level of $103.04 and currently is trading around this level after a bounce from the trend line (in orange).
The larger time-frames trend remains down and all the upwards moves are still being treated as a local upwards correction in the downtrend.
Weekly Pivots:
WR3 - $120.96
WR2 - $116.15
WR1- $109.20
Weekly Pivot - $103.98
WS1 - $97.56
WS2 - $92.53
WS3 - $85.86
Trading recommendations:
The bounce from the local trendline might be short-lived and the market might resume the short-term downtrend pretty soon. This is why short orders should be opened if the local support at the level o103.16 is clearly violated. Targets for day traders are seen at the levels of $101.56, $100.31 and $99.07.

