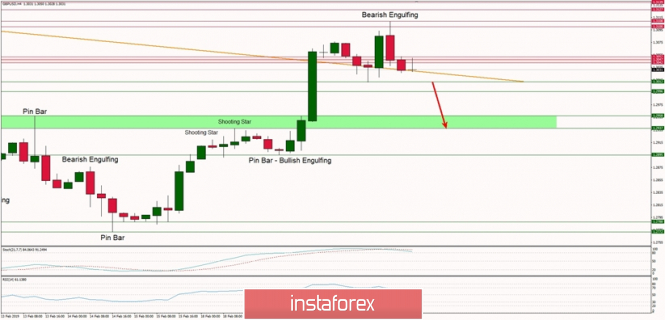
GBP/USD technical analysis for 21/02/2019:
Another sign of weakness made by the market
Technical market overview:
The GBP/USD pair is sending another bearish signal despite the fact the 61% Fibonacci retracement level has been broken and a new local high was made at the level of 1.3108. The price has already broken below the technical support at 1.3042 after the Bearish Engulfing candlestick pattern was made and it looks it is going lower towards the technical support at the level of 1.3012 and 1.2996. The market conditions are overbought and the momentum is pointing to the downside, which again supports the short-term bearish outlook.
The larger time frame trend is still down, so any spikes up should be treated as a local upward correction during the downtrend.
Weekly Pivot Points:
WR3 - 1.3163
WR2 - 1.3061
WR1 - 1.2979
Weekly Pivot - 1.2879
WS1 - 1.2794
WS2 - 1.2689
WS3 - 1.2606
Trading recommendations:
The sell orders should still be kept open. The first target is seen at the level of 1.3012 and 1.3000. In a case of any breakout lower, the next target is seen at the level of 1.2958.

