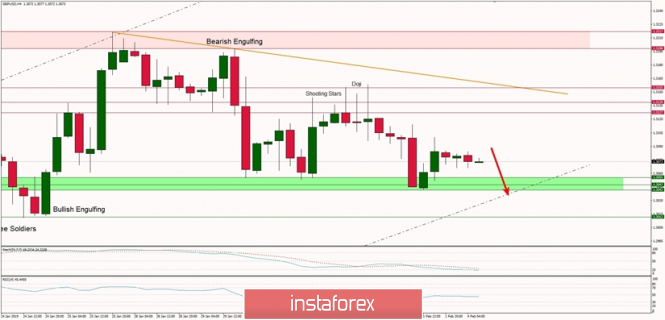
Technical analysis of GBP/USD for 04/02/2019:
The technical support still holds, but for how long?
Market technical overview:
The GBP/USD pair is locked in a narrow horizontal zone as it continues the sideways move. The nearest support zone located between the levels of 1.3042 - 1.3055 has been tested three times already and the bears did not give up yet as there is no clear upwards move towards the resistance at the level of 1.3127. It might suggest, the bears will try to break through the support zone and move towards the next support at the level of 1.3012. The price action around the technical resistance zone between the levels of 1.3127 - 1.3155 confirms the short-term bearish outlook.
Weekly Pivot Points:
WR3 - 1.3333
WR2 - 1.3261
WR1 - 1.3158
Weekly Pivot Point - 1.3101
WS1 - 1.2987
WS2 - 1.2928
WS3 - 1.2810
Trading recommendations:
As long as the price stays below the level of 1.3100 (50% Fibo) or 1.3114 (61% Fibo) the outlook remains bearish, so only sell orders should be in place with the entry as close as possible to this levels. The target is seen at the level of 1.3055 or 1.3042, but if the breakout will be strong, then the sell-off might accelerate to the level of 1.3012.

