Technical outlook:
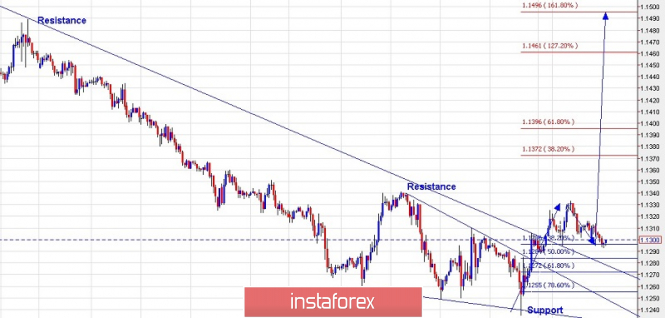
An hourly chart for EUR/USD has been displayed since January 31, 2019 until today to have a small- to medium-term outlook for the wave structure. It is seen that prices broke above the diagonal structure as well as the resistance line dropping since January 31, 2019 highs at 1.1514 levels (not seen on displayed view here). The EUR/USD pair made a high around 1.1334 levels, just shy of initial resistance at 1.1340, before retracing lower. It has managed to reach the fibonacci 0.382 support of the rally between 1.1233 and 1.1334 at 1.1293 today and is seen to be trading around the same levels for now. If we could look into the wave structure, the recent rally could be seen as an initial sign of bulls gaining control back. Price support is seen through 1,1270 levels which is fibonacci 0.618 support of the above rally. A bullish reversal should be watched around those levels for an extended rally towards 1.1490 levels going forward. Ideally, prices should stay above 1.1233 levels for the above scenario to hold true.
Trading plan:
Remain long, stop below 1.1233, target 1.1490.
Good luck!
The material has been provided by InstaForex Company - www.instaforex.com