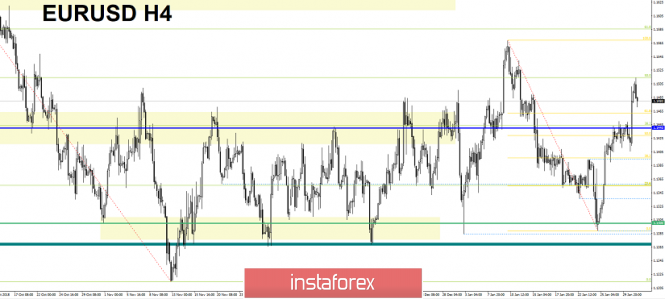
The currency pair Euro / Dollar for the last trading day showed a high volatility of 96 points, forming as a result of pulsed candles. From the point of view of technical analysis, we see that after a two-day stagnation within the range level of 1.1440 (1.1420 / 1.1460), the exit phase came, which resulted in a breakdown of the upper boundary and flight to 1.1515. What was this activity related to? Of course, with the information and news background. Yesterday an important event took place - the meeting of the Federal Reserve System - which many traders were waiting for. On it, our dear Jerome Powell brought a surprise to speculators in the form of the fact that in his speech he removed the mention of the upcoming increase in the interest rate. Recall that at the December meeting it was said that in 2019 a double rate increase is possible. Now in the context of these words there is no, but Jerome added that, if necessary, the Fed can mitigate the parameters of monetary policy by reducing the monthly volume of asset repurchases. Naturally, this news shocked the markets, and the euro literally soared by more than 80 points, leaving behind impulse candles. One cannot miss the background of the visit of the British Prime Minister Theresa May to Brussels with the aim of begging for the best conditions for England. In turn, the head of the European Council, Donald Tusk, has already managed to declare that "the agreement on withdrawal is not subject to revision. On February 29, we are not quite sure what the United Kingdom wants. The euro literally soared by more than 80 points, leaving behind pulsed candles. One cannot miss the background of the visit of the British Prime Minister Theresa May to Brussels with the aim of begging for the best conditions for England. In turn, the head of the European Council, Donald Tusk, has already managed to declare that "the agreement on withdrawal is not subject to revision.

From the current news calendar, we have already released data on GDP in Europe, where there is a slowdown in economic growth from 1.6% to 1.2%. In the afternoon, we are waiting for statistics from the United States on sales of new housing. This is where growth is predicted: Prev. 544K ---> Forecast 560K.
Further development
Analyzing the current trading schedule, we see a logical reversal of the recent rally field; the current news background in Europe still helps us with this. It is likely to assume that the current mood will continue in the market and the bears will try to roll back the quotation to 1.1460-1.1450. Otherwise, the stagnation phase will begin within the first point.

Based on the available data, it is possible to decompose a number of variations, let's consider them:
- We consider buying positions in two monitors : First, in case of loss of bearish interest and fixation above the current local maximum of 1.1515; The second, already in the case of stagnation within the level of 1.1440.
- Traders are already considering selling positions with the prospect of 1.1460-1.1450.
Indicator Analysis
Analyzing a different sector of timeframes (TF ), we see that in the short term, there was a downward interest against the background of the current pullback. Intraday and mid-term perspectives retain an upward interest.
Weekly volatility / Measurement of volatility: Month; Quarter; Year
Measurement of volatility reflects the average daily fluctuation , with the calculation for the Month / Quarter / Year.
(January 31, was based on the time of publication of the article)
The current time volatility is 43 points. It is likely to assume that the volatility of the current day may be maintained within the framework of the daily average.
Key levels
Zones of resistance: 1.1550; 1.1650 *; 1.1720 **; 1.1850 **; 1.2100
Support areas: 1.1440; 1.1350 *; 1,1300 **; 1.1214 **; 1.1120; 1.1000
* Periodic level
** Range Level
The material has been provided by InstaForex Company - www.instaforex.com