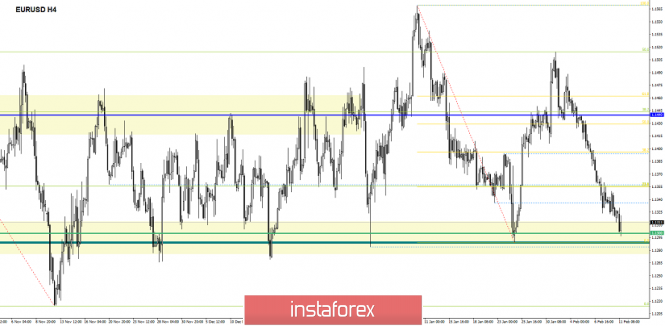
By the end of the trading week, the Euro / Dollar currency pair again showed extremely low volatility of 30 points, but the overall plan has not yet changed for the downward movement. From the point of view of technical analysis, we have a stable downward movement with a starting value of 1.1515, where traders are confidently directed towards the main range level of 1.1280 / 1.1300, which, in principle, has almost happened. The news background over the past weekend did not have any attacks. British Prime Minister Theresa May promises new debates on Brexit, waiting for a chance to negotiate with EU officials. There is almost no time left until the day "X" because Britain leaves the European Union in less than 47 days (March 29). Meanwhile, voting in the Parliament regarding the Brexit agreement is postponed from the current week to an unspecified date.

Further development
Analyzing the current trading schedule, we see how earlier forecasts are performed on the trading schedule. The quotation still managed to touch the range level 1.1280 / 1.1300, where it already feels a certain point of support. It is likely to assume that the current coordinates in the face of the level of 1.1280 / 1.1300 will try to keep the quote and bring some kind of corrective movement to the market. In turn, traders lead their short positions to the finish line, which they still kept from breaking through the level of 1.1440. Another part of the traders will have to wait a little bit longer, tracking the foothold for the breakdown, while holding a much smaller part of the position in the market.
Based on the data available, it is possible to decompose a number of variations, let's consider them:

- Buy positions are considered in the case of working out the range level 1.1280 / 1.1300 and price fixing is higher than 1.1340
- We consider selling positions in case of a clear price fixing lower than 1.1270.
Indicator Analysis
Analyzing a different sector of timeframes (TF ), we see that in the short term, there has been an upward interest against the background of the initial testing of the range level. Intraday and mid-term perspective preserves the descending interest against the general background of the movement.
Weekly volatility / Measurement of volatility: Month; Quarter; Year
Measurement of volatility reflects the average daily fluctuation , with the calculation for the Month / Quarter / Year.
(February 11 was based on the time of publication of the article)
The current time volatility is 44 points. It is likely to assume that the volatility of the day will be lower than the average daily indicator, referring to earlier statistics and the possibility of a temporary stagnation within the range level.
Key levels
Zones of resistance: 1.1350 *; 1.1440; 1.1550; 1.1650 *; 1.1720 **; 1.1850 **; 1.2100.
Support areas: 1.1300 **; 1.1214 **; 1.1120; 1.1000
* Periodic level
** Range Level
The material has been provided by InstaForex Company - www.instaforex.com