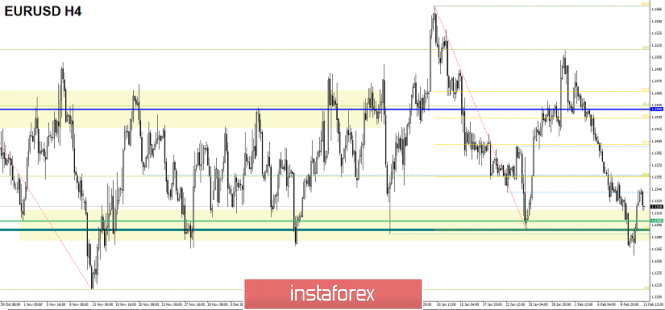
The currency pair Euro / Dollar for the last trading day showed a high volatility of 82 points, as a result of having a high-quality working out of the range level of 1.1280 / 1.1300. From the point of view of technical analysis, we have a rather expected move. previous review,

Today, in terms of the economic calendar , we have already published statistics on industry in Europe, where everything turned out to be much worse than the forecasts. They expected a decline of 3.3%, resulting in a decrease of 4.2%. In the afternoon, we are waiting for the main news. This is data on the inflation of the United States, which will definitely play into the hands of volatility.
United States 16:30 Moscow time - Inflation rate on year: Prev. 1.9% ---> Forecast 1.5%
Further development
Analyzing the current trading chart, we see that the primary rebound from the range level 1.1280 / 1.1300 led us to a value of 1.1341, after which we saw a stagnation against the background of irrelevant statistics from Europe, rollback. In turn, traders are waiting for data on US inflation, where growth may resume after. Points for further purchases are considered already higher than 1.1350, with the prospect of 1.1370-1.1400. The downside, which is also considered by traders, is to clamp the quotes to the amplitude of 1.1280 / 1.1330.

Based on the available data, it is possible to decompose a number of variations, let's consider them:
-Positions to buy, as discussed in the previous review, traders considered the point 1.1315 to enter long positions. If we do not have a deal, then it is better to consider a clear fixation higher than 1.1350.
- Positions for sale - no positions available. Any consideration in the current time will occur in the case of a clear price fixing lower than 1.1250, so as not to run into the false bumpkin. In the event of further corrective movement, the position to sell is postponed for a longer period.
Indicator Analysis
Analyzing a different sector of timeframes (TF ), we see that in the short, intraday and medium term had a cycled downward interest due to an earlier move. Indicators indicators on smaller TF vary due to the current bumpiness.
Weekly volatility / Measurement of volatility: Month; Quarter; Year
Measurement of volatility reflects the average daily fluctuation , with the calculation for the Month / Quarter / Year.
(February 13 was based on the time of publication of the article)
The current time volatility is 28 points. Volatility may increase at the time of publication of data from the United States.
Key levels
Zones of resistance: 1.1350 *; 1.1440; 1.1550; 1.1650 *; 1.1720 **; 1.1850 **; 1.2100
Support areas: 1.1300 **; 1.1214 **; 1.1120; 1.1000
* Periodic level
** Range Level
The material has been provided by InstaForex Company - www.instaforex.com