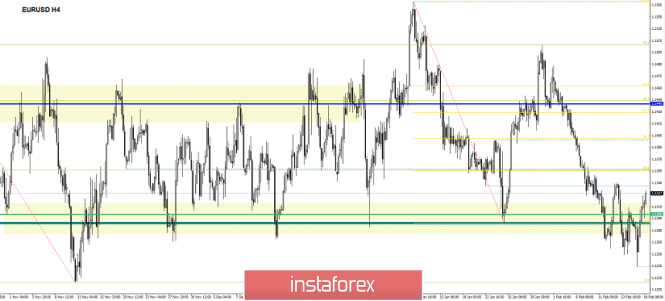
By the end of the last trading week, the Euro / Dollar currency pair showed a volatility equal to the average daily 72 points. As a result, the quote retraced above the range level and was able to fix above this level. From the point of view of technical analysis, we see that the attempt to resume the downward movement failed. After a wide amplitude, the price still returned to the range of the range level 1.1280 / 1.1300. Afterwards, the price was able to fix above this range level. Statistical data on industrial production in the United States showed a rapid decline from 4.1% to 3.8%. This is along with data on US retail sales published on Thursday (a decrease from 4, 1% to 2.3%). Now, we have a quite strong negative background on the dollar. Based on the results, it is obvious that the quote broke up.

According to the economic calendar, there are no current news since the Presidential Day was celebrated in the States. Due to this timely pause, it can be said that trading volumes can be reduced. Of course, in the absence of news, you should not forget about the information background centered around the issue on Brexit.
Further development
Analyzing the current trading chart, we see a real possibility of a reversal .The quote is confidently fixed above the range level of 1.1280 / 1.1300, moving closer to the local maximum of 1.1340 of February 13 (the first attempt at rebound). This probably serves as a suggestion to converge with the value of 1.1340. In this case, there is a need to monitor the price behavior. If a price fixation will occur above this level, you can assume a movement to 1.1400-1.1440. Otherwise, there is a possibility to go back to the range level 1.1280 / 1.1300.

Based on the available data, it is possible to decompose a number of variations, let's consider them:
- We consider buying positions in case of price fixing higher than 1.1340, with the prospect of a move to 1.1400-1.1440.
- We consider selling positions in the case of temporary resistance in the area of 1.1340, with a reverse return to 1.1280 / 1.1300.
Indicator Analysis
Analyzing the different timeframe (TF) sector , we can see that in the short and intraday perspective, there is an upward interest against the background of the recent jump. The medium-term outlook keeps the initial downward interest against the general background of the market.
Weekly volatility / Measurement of volatility: Month; Quarter; Year
Measurement of volatility reflects the average daily fluctuation , with the calculation for the Month / Quarter / Year.
(February 18 was based on the time of publication of the article)
The current time volatility is 41 points. It is likely to assume that in case of a breakdown of the value of 1.1340, the volatility may continue its growth.
Key levels
Zones of resistance: 1.1340 *; 1.1440; 1.1550; 1.1650 *; 1.1720 **; 1.1850 **; 1.2100
Support areas: 1.1300 **; 1.1214 **; 1.1120; 1.1000
* Periodic level
** Range Level
The material has been provided by InstaForex Company - www.instaforex.com