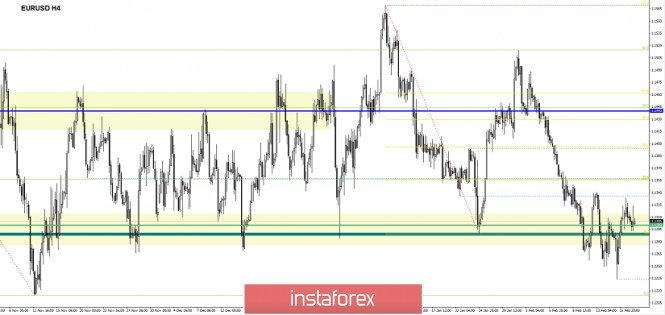
The Euro / Dollar currency pair for the last trading day showed low volatility of 44 points. As a result, the pair remains to be at a range level. From the point of view of technical analysis, we can see that after an intensive move, the quotation rolled back again to the range of the range level 1.1280 / 1.1300. However, this time, we saw a clear attempt by the bulls to change the already stable market interest. No statistics was shown in the news background. This is also due to the previous day off in the United States, which led to a decrease in trading volumes. From the information background, I can single out only a small splash from the shores of the old world regarding the Brexit agreement. Members of the British Cabinet threatened the head of government, Teresa May, with a succession of resignations if she did not rule out the possibility of Brexit without a deal with the EU.

Further development
Analyzing the current trading chart, we see an amplitude oscillation within the range level of 1.1280 / 1.1300, where the quote is trying to find a foothold, but still it remained at the same limits. It is likely to assume the preservation of the current amplitude oscillation with an extension to the framework of 1.1280 / 1.1340. Traders, in turn, monitor these boundaries for breakdown. And of course, special attention is paid to the upper boundary.

Based on the available data, it is possible to expand a number of variations, let's consider them:
- We consider buying positions in case of price fixing higher than 1.1340, with the prospect of a move to 1.1400-1.1440.
- Positions for sale, as already mentioned in the previous review, were conducted according to the principle of small positions that developed within the range of 1.1280 / 1.1340, that is, testing the value of 1.1340 which brings us back to 1.1300. This happened in principle.
Indicator Analysis
Analyzing the different timeframe (TF) sector , we can see that in the short and intraday perspective, there is an upward interest against the background of the recent jump. The medium-term outlook keeps the initial downward interest against the general background of the market.
Weekly volatility / Measurement of volatility: Month; Quarter; Year
Measurement of volatility reflects the average daily fluctuation , with the calculation for the Month / Quarter / Year.
(February 19 was based on the time of publication of the article)
The current time volatility is 31 points. It is likely to assume that if the stagnation drags on, the volatility will remain low. But if the quotation still manages to break out above 1.1340, then we can talk about the process of working out the range level and thus, it will result to an increasing volatility.
Key levels
Zones of resistance: 1.1340 *; 1.1440; 1.1550; 1.1650 *; 1.1720 **; 1.1850 **; 1.2100
Support areas: 1.1300 **; 1.1214 **; 1.1120; 1.1000
* Periodic level
** Range Level
The material has been provided by InstaForex Company - www.instaforex.com