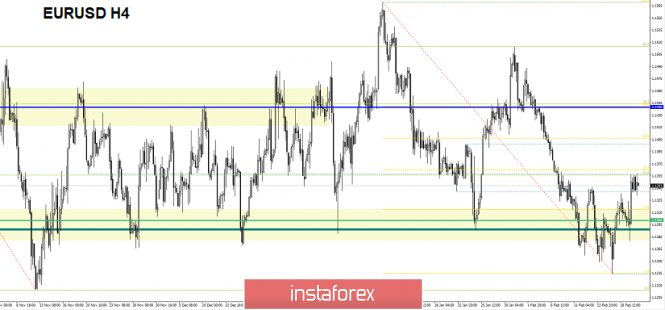
The currency pair Euro / Dollar for the last trading day showed high volatility of 82 points. As a result, it reached the long-awaited upward move. From the point of view of technical analysis, we see no longer an attempt, but a full-fledged testing of the range level of 1.1280 / 1.1300 in the upstream direction, where the quote managed to jump up to the value of 1.1357. As a result, a cluster has been formed near this coordinate. No statistics were shown on the United States. However, there were rumors pointing out the Fed's decision to suspend any statements regarding monetary policy until a trade agreement is signed between USA and PRC. From the background information, it is also possible to single out the statement of the head of the European Commission Jean-Claude Juncker regarding the agreement on Brexit: "Any decision to ask for more time lies with the UK. If such a request is made, no one in Europe will be against it. If you ask how long you can postpone the exit, I have no time frame, "Juncker said.

Today, two news are in the spotlight : the first, of course, is the publication of the FOMC protocol, where market participants are waiting for hints about whether the Fed will stop reducing its balance sheet. Then we have another meeting between Theresa May and Jean-Claude Juncker in Brussels, where the British Prime Minister will again urge the head of the European Commission to make concessions, but I think the next round will again end in nothing.
20:30 Moscow time - Theresa May and Jean-Claude Juncker meeting in Brussels
22:00 MSK - Publication of FOMC protocols
Further development
Analyzing the current trading chart, we see a clear slowdown of 1.1330 / 1.1360 after the recent impulse. It is likely to assume that there is a distinct cluster, which can be characterized as a regrouping of trading forces. This type of accumulation is very likely to lead to another surge, and if the FOMC protocol upsets market participants, we will see a further upward trend. In turn, traders are insured and stretch pending orders in both directions at once.

Based on the available data, it is possible to expand a number of variations, let's consider them:
- Positions for purchase - if we still do not have positions, then it is possible to consider them higher than 1.1370, with the prospect of a move towards 1.1400-1.1440.
- We consider selling positions in the case of price fixing lower than 1.1330, with a return to 1.1300.
Indicator Analysis
Analyzing the different timeframe (TF) sector , we see that in the short and intraday perspective there is an upward interest against the background of the recent jump. The medium-term outlook keeps the initial downward interest against the general background of the market.
Weekly volatility / Measurement of volatility: Month; Quarter; Year
Measurement of volatility reflects the average daily fluctuation, with the calculation for the Month / Quarter / Year.
(February 20 was based on the time of publication of the article)
The current time volatility is 27 points, which is a low value for a given time interval. It is likely to assume that the current cluster is connected to some extent with the upcoming informational and news background, which can betray volatility.
Key levels
Zones of resistance: 1.1440; 1.1550; 1.1650 *; 1.1720 **; 1.1850 **; 1.2100
Support areas: 1.1340 *; 1,1300 **; 1.1214 **; 1.1120; 1.1000
* Periodic level
** Range Level
The material has been provided by InstaForex Company - www.instaforex.com