For the last trading day, the currency pair Euro / Dollar showed low volatility of 46 points, as a result of having stagnation with a rollback. From the point of view of technical analysis, we see stagnation with a slight recoil, where the quotation still tries to keep within the framework of the recent accumulation of 1.1330 / 1.1360. The information and news background had two important events in itself, the first was the meeting of the British Prime Minister Theresa May and Jean-Claude Juncker in Brussels, which once again failed to produce results. Following the talks, Theresa May stated in her tradition that she had a constructive meeting with Chairman Juncker, stressing that it was necessary to make such legally binding changes in the backstop mechanism that would guarantee that it to be limited. This is what is needed for the transaction to be approved by the House of Commons. However, it should be understood that the decision of the EU regarding the agreement remained the same. The second important event was the publication of the protocol of the Federal Commission on Open Market Operations, which, as expected, did not contain any harsh statements regarding monetary policy, thus there was no protocol for the market.

Today, in terms of the economic calendar, we have fairly broad statistics from the United States, which in general is not so bad. The total number of people receiving unemployment benefits is reduced from 1.7373K to 1.740K. In turn, the volume of orders for durable goods show an increase of 1.7%, as well as, in principle, sales in the secondary housing market (January) show an increase from 4.99M to 5.01M.
Further development
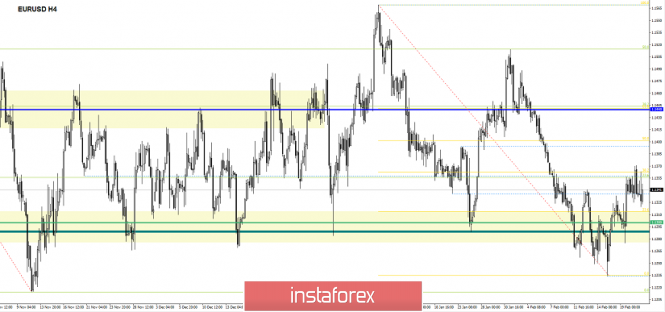
Analyzing the current trading chart, we see that the quotation has returned to the limits of the 1.1330 / 1.1360 cluster, having a cluster of 23.6 and 38.2 levels from Fibo. It is likely to assume that the amplitude oscillation within the boundaries of the cluster will still persist, not excluding the further formation of a rollback due to statistical data coming out in the United States. At the same time, traders intently monitor price action, or rather, fixation above the Fibo 1.1375 cluster, which may lead to further growth.

Based on the available data, it is possible to expand a number of variations, let's consider them:
- We consider buying positions in the case of price fixing higher than 1.1375 with the prospect of a move to 1.1400-1.1440.
- Positions for sale are considered in the local pullback to 1.1300. Something more significant will be considered already in the case of fixation lower than 1.1280.
Indicator Analysis
Analyzing the different sector of timeframes (TF ), we see that in the short, intraday and medium term there is an upward interest against the background of the recent jump. Indicators of indicators on smaller TFs may vary, as the price is within the cluster.
Weekly volatility / Measurement of volatility: Month; Quarter; Year
Measurement of volatility reflects the average daily fluctuation , with the calculation for the Month / Quarter / Year.
(February 21 was based on the time of publication of the article)
The current time volatility is 43 points. If the quote remains within the cluster, the volatility will continue to fluctuate within the daily average.
Key levels
Zones of resistance: 1.1440; 1.1550; 1.1650 *; 1.1720 **; 1.1850 **; 1.2100
Support areas: 1.1340 *; 1,1300 **; 1.1214 **; 1.1120; 1.1000
* Periodic level
** Range Level
The material has been provided by InstaForex Company - www.instaforex.com