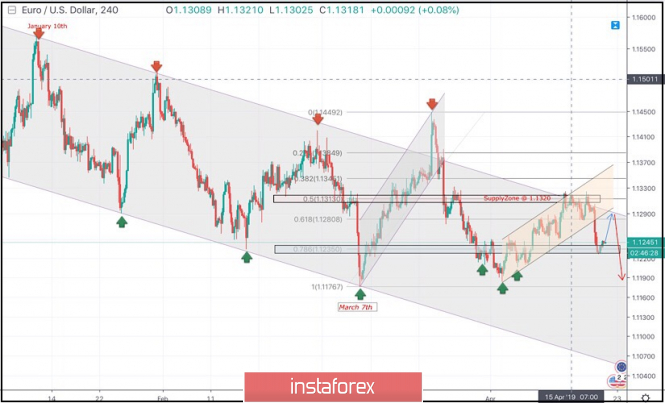
On January 10th, the market initiated the depicted bearish channel around 1.1570.
Since then, the EURUSD pair has been moving within the depicted channel with slight bearish tendency.
On March 7th, recent bearish movement was demonstrated towards 1.1175 (channel's lower limit) where significant bullish recovery was demonstrated.
On March 18, a significant bullish attempt was executed above 1.1380 (the upper limit of the Highlighted-channel) demonstrating a false/temporary bullish breakout.
On March 22, significant bearish pressure was demonstrated towards 1.1280 then 1.1220.
Two weeks ago, a bullish Head and Shoulders reversal pattern was demonstrated around 1.1200. This enhanced further bullish advancement towards 1.1300-1.1315 (supply zone) where recent bearish rejection was being demonstrated.
Short-term outlook turned to become bearish towards 1.1280 (61.8% Fibonacci) followed by further bearish decline towards 1.1235 (78.6% Fibonacci).
For Intraday traders, the current price zone around 1.1235 (78.6% Fibonacci) stands as a prominent demand area to be watched for a possible short-term BUY entry.
However, conservative traders should be waiting for a bullish pullback towards 1.1280-1.1290 (backside of the broken bullish channel) for a valid SELL entry.
Moreover, bearish breakdown below 1.1235 opens the way for further bearish decline towards 1.1180-1.1170.
Trade recommendations :
A valid SELL entry can be taken around 1.1280 - 1.1290 when a bullish pullback occurs.
TP levels to be located around 1.1250, 1.1235 and 1.1170. SL should be placed above 1.1320.
The material has been provided by InstaForex Company - www.instaforex.com