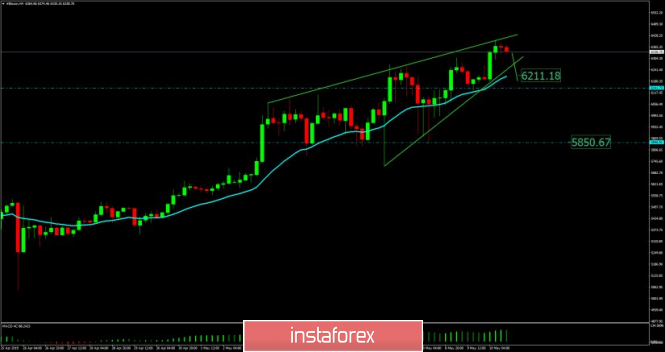
BTC has been trading upwards. The price tested the level of $6.400. Anyway, buying looks very dangerous and selling is preferable.

Green lines – Rising wedge in creation (bearish pattern)
Blue line – 20 Exponential moving average
White diagonal line – Resistance on the test
Blue horizontal line – Support 1 ($6.141)
Blue horizontal line – Support 2 ($5.850)
Rising wedge is in creation, which may represent strong sign of the weakness on BTC. The bearish divergence is present, which adds more potential weakness on BTC. Support levels are seen at the price of $6.211 and $5.850. Resistance level is found at $6.400. Since the BTC is on the extended-up run, there are high odds that sell off might happen, so be prepared. Watch for selling opportunities with the first target at $6.211.
The material has been provided by InstaForex Company - www.instaforex.com