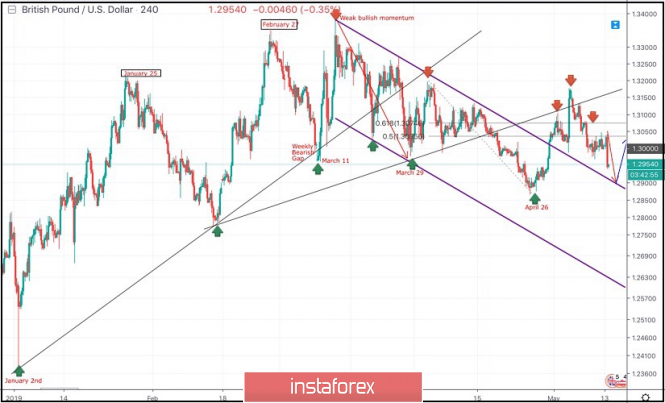
On March 29, the price levels of 1.2980 (the lower limit of the newly-established bearish movement channel) demonstrated significant bullish rejection.
This brought the GBPUSD pair again towards the price zone of (1.3160-1.3180) where the upper limit of the depicted bearish channel as well as the backside of the depicted broken uptrend line demonstrated significant bearish rejection.
Since then, Short-term outlook has turned into bearish with intermediate-term bearish targets projected towards 1.2900 and 1.2850.
On April 26, a bullish pullback was executed towards the price levels around 1.3035 - 1.3070 (50% - 61.8% Fibonacci levels) where temporary bearish rejection was demonstrated.
Shortly after, a bullish breakout above 1.3075 was temporarily being demonstrated until bearish breakdown below 1.3035 (50% Fibonacci level) was achieved earlier last week.
Hence, a bearish Head and Shoulders pattern is being demonstrated on the H4 chart with neckline located around 1.2985.
As anticipated, The price zone of 1.3030-1.3060 turned to become a prominent supply-zone where a valid bearish entry was offered by the end of last week's consolidations.
For the bearish Head and Shoulders pattern to remain valid, bearish persistence should be maintained below 1.2985 (Neckline).
Initial bearish Target would located around 1.2905 where another short-term bullish pullback may be initiated towards 1.2985.
Trade Recommendations:
For those who had a valid SELL entry around the price levels of (1.3035-1.3070). It's already running in profits. T/p levels to be located around 1.2950 and 2905 while S/L should be lowered to 1.2990 to secure some profits.
The material has been provided by InstaForex Company - www.instaforex.com