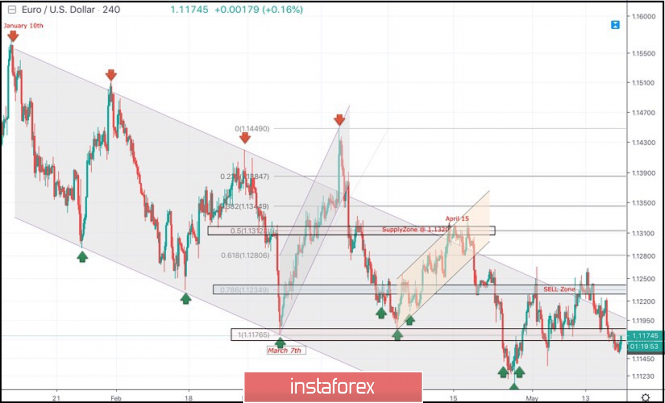
On January 10th, the market initiated the depicted bearish channel around 1.1570.
Since then, the EURUSD pair has been moving within the depicted channel with slight bearish tendency.
Few weeks ago, a bullish Head and Shoulders reversal pattern was demonstrated around 1.1200.
This enhanced further bullish advancement towards 1.1300-1.1315 (supply zone) where significant bearish rejection was demonstrated on April 15.
Short-term outlook turned to become bearish towards 1.1235 (78.6% Fibonacci) then 1.1175 (100% Fibonacci level).
For Intraday traders, the price zone around 1.1235 (78.6% Fibonacci) stood as a temporary demand area which paused the ongoing bearish momentum for a while before bearish breakdown could be executed on April 23.
That's why, the mentioned price zone around 1.1235-1.1250 has turned into supply-zone to be watched for bearish rejection.
Shortly-after, the market has failed to sustain bearish pressure below the price Level of 1.1175 during the previous weeks' consolidations.
That's why, another bullish pullback was expected to occur towards the price zone of 1.1230-1.1250 where significant bearish pressure was expected to exist there.
Since May 3, the EURUSD pair has been maintained above the depicted key-zone (1.1175) until Friday when a bearish breakout below 1.1175 was achieved.
This enhances further bearish decline towards 1.1115 provided that no bullish breakout above 1.1190 is demonstrated on the H4 chart.
Trade recommendations :
Conservative traders who were advised to have a SELL entry around the supply zone (1.1235-1.1250) should lower their S/L towards 1.1190 to secure more profits.
Remaining Target level should be projected towards 1.1115.
The material has been provided by InstaForex Company - www.instaforex.com