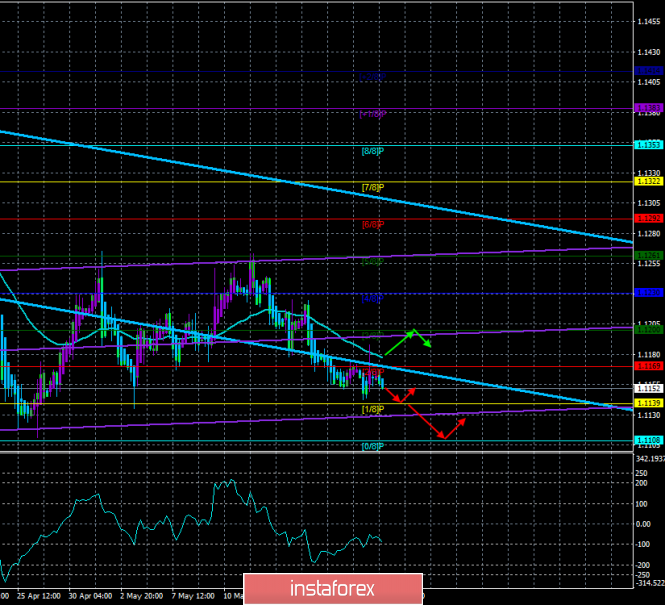
4-hour timeframe

Technical data:
The upper linear regression channel: direction – down.
The lower linear regression channel: direction – up.
The moving average (20; smoothed) – down.
CCI: -86.8916
Yesterday, the EUR/USD currency pair adjusted within just one hour to the moving average line, rebounded from it and maintained a downward trend. Thus, the bears remain "at the helm" of the market, and the next attempt of bulls to seize the initiative failed. We once again note that even when the bulls manage to overcome the moving, that is, the trend is changing to an upward one, this does not mean that the bulls have gained enough strength. As we have said more than once, in 2019, the trend is clearly downward, and each subsequent price high is lower than the previous one. In this regard, the euro/dollar does not change anything. This means that market participants can still expect the pair to decline under the previous low (1.1111). In fundamental terms, today we should pay attention to the speech of the ECB head Mario Draghi in Frankfurt, which will be held in just an hour, as well as the evening publication of the minutes of the meeting of the Federal Open Market Committee. Both of these events may not have any impact on the course of trading, since it is not the fact that Draghi will report anything interesting, and the Fed's protocols usually contain information known to everyone for a long time. Nevertheless, surprises are possible, and during these events, it is recommended to be ready for an increase in volatility, and for a sharp reversal of the EUR/USD quotes.
Nearest support levels:
S1 – 1.1139
S2 – 1.1108
S3 – 1.1078
Nearest resistance levels:
R1 – 1.1169
R2 – 1.1200
R3 – 1.1230
Trading recommendations:
The EUR/USD currency pair resumed its downward movement after a minimal correction. Thus, it is now recommended to trade short positions with targets of 1.1139 and 1.1108.
It is recommended to consider long positions on the euro/dollar pair with extreme caution and small lots, not before fixing the price above the moving average line with the first target of 1.1230.
In addition to the technical picture should also take into account the fundamental data and the time of their release.
Explanation of illustrations:
The upper linear regression channel – the blue line of the unidirectional movement.
The lower linear regression channel – the purple line of the unidirectional movement.
CCI – the blue line in the indicator window.
The moving average (20; smoothed) is the blue line on the price chart.
Murray levels – multi-colored horizontal stripes.
Heiken Ashi is an indicator that colors bars in blue or purple.
The material has been provided by InstaForex Company - www.instaforex.com