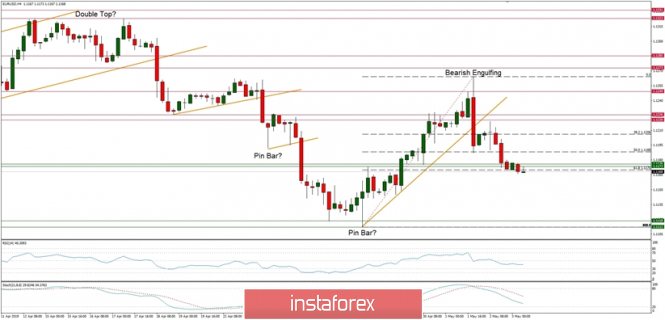
Technical Market Overview:
The EUR/USD pair has broken below the 61% Fibonacci retracement at the level of 1.1170 after the Bearish Engulfing candlestick pattern was made around the level of 1.1265. The price has broken through the short-term trendline support as well and is on its way to the level of 1.1150 first and then towards 1.1111. The weak and negative momentum together with descending stochastic oscillator support this view.
Weekly Pivots:
WR3 - 1.1369
WR2 - 1.1315
WR1 - 1.1220
Weekly Pivot: 1.1165
WS1 - 1.1067
WS2 - 1.1006
WS3 - 1.0913
Trading recommendations:
The sell orders should be now in play due to the potential reversal candlestick pattern at the H4 time frame chart. Any breakout below the level of 1.1176 might accelerate the losses and the price will dive towards the level of 1.1118.

