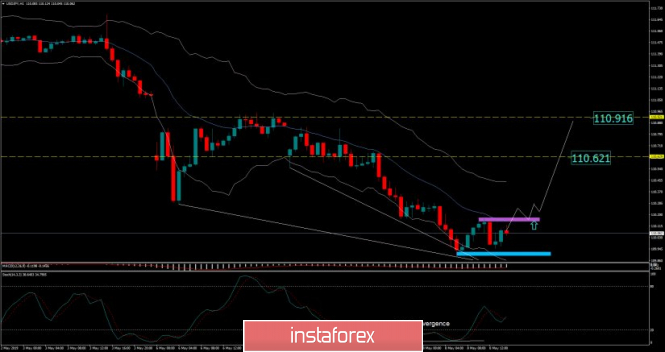
Gold has been trading downwards as we expected. The price tested the level of 109.90. Anyway, we found that sellers are losing down momentum, which may be a strong sign for potential rally in the future.

Purple rectangle – Intraday resistance 110.17
Blue rectangle – Short-term support 109.90
Blue line – Middle of Keltner Channel EMA 110.15
Yellow horizontal line – Resistance 1
Yellow horizontal line – Resistance 2
According to the H1 time-frame, we found bullish divergence on the stochastic oscillator, which is sign that sellers lost momentum and that buyers may react. Our advice is to watch for confirmation of the bullish trend, which is at least 2 higher lows on the 30M time-frame in order to confirm the bullish trend. Upward references are set at 110.62 and 110.91. Key support is set a the price of 109.90. Watch for buying opportunities.
The material has been provided by InstaForex Company - www.instaforex.com