EUR/USD
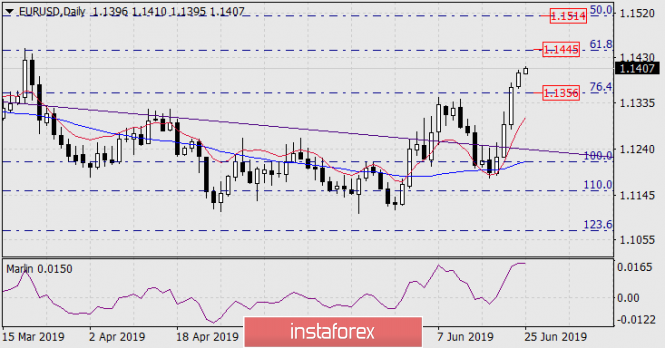
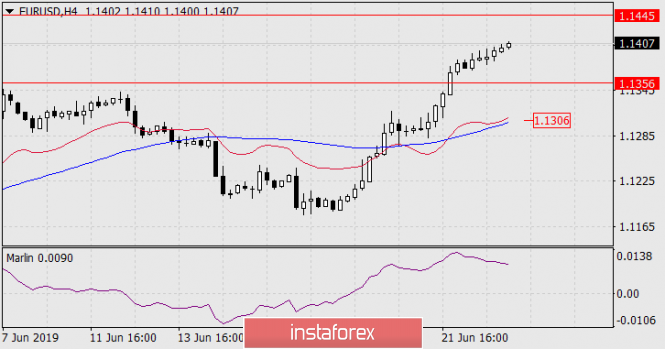
On Monday, the euro increased by 28 points - growth slowed, and the leading Marlin oscillator on the daily and four-hour charts began to discharge, relieve tension. This can be both an early signal for a trend reversal, and the indicator itself is discharged before further growth of the instrument. Visually, the Marlin is discharged before growth.
The price develops in the range between the two Fibonacci levels of the daily chart: 76.4% (1.1356) and 61.8% (1.1445), the bottom line serves as support, respectively, the correction before further euro growth can be to this level. Growth can continue without a correction to the resistance of 1.1445. Consolidating above the level will make it possible for the price to reach the next Fibonacci level of 50.0% (1.1514), which coincides with the high on January 31.
Consolidating the price below 1.1356 will make it possible to work out the MACD line on the four-hour chart around 1.1306.


