EUR/USD
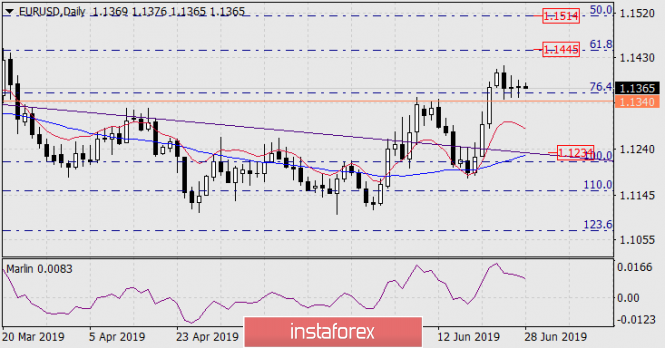
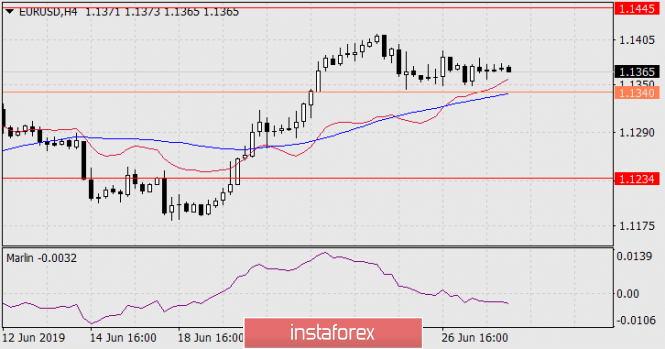
The third day began, as the euro hardly moves from its place in anticipation of decisions from the fields of the G20 and the EU summit. As a result, the indicator lines on the H4 chart are approaching the current price, the oscillator lines on the daily and H4 continue to decline. Now, to create a signal in the medium-term sale, the price is enough to gain a foothold under the MACD line on the four-hour chart (1.1340), which is very close to the lows of the last days. The goal of reducing 1.1234 – the area of coincidence of the nested line of the price channel and the MACD line on the daily scale chart.
But, despite the strengthening of the declining version of the order to 65%, the possibility of growth of 35% is high enough to be realized in the movement to 1.1514 – the Fibonacci level of 50% on the daily chart (coincides with the top of January 2019). The growth can consist of two stages: the movement to the Fibonacci level of 61.8% at the price of 1.1445 and the movement to 1.1514. It remains to wait for developments. Again, on the G20, preliminary events are still developing in favor of the dollar.


