GBP/USD
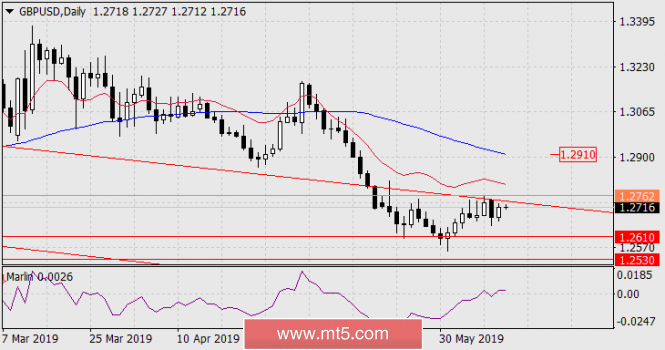
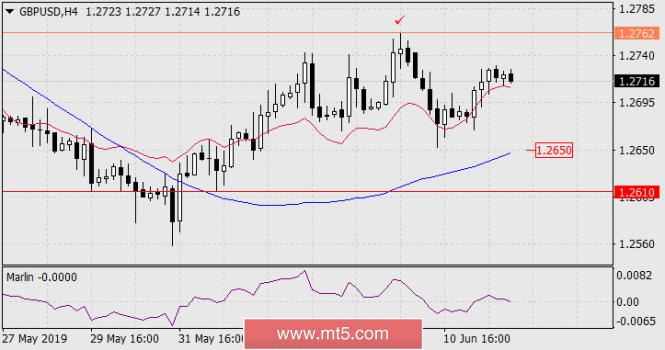
In yesterday's review, we wrote that the withdrawal of the price under the balance line on the H4 chart will mean a trend shift towards a fall, and because of the trend on the daily scale, this option is the most promising. But over the past day, even the trend of the daily chart has changed. The signal line of the Marlin oscillator did not go deeper into the zone of decline and formed a hint of a double top (indicated by arrows). On H4, the price could not overcome the support of the red indicator line of the balance. Marlin on the same chart also returned to the growth zone. Taking into account the leading character of this oscillator, the chances of GBP/USD pair growth are increasing. To form a trend, the price needs to gain a foothold over the high of June 7 (1.2762), then the prospect of growth to the MACD line on the daily chart, in the area of 1.2910.


The reduction scenario can be realized in the case of the price fixation under the balance line on the H4 because the double top on the Marlin oscillator on the daily chart can be realized and the signal line of the oscillator on the H4 also has the opportunity of deepening in the area of negative numbers. The immediate goal of reducing 1.2650 is to support the MACD line. Fixing under it opens the target 1.2610 – at least August 15.
The probability of both scenarios is equal.
The material has been provided by InstaForex Company - www.instaforex.com