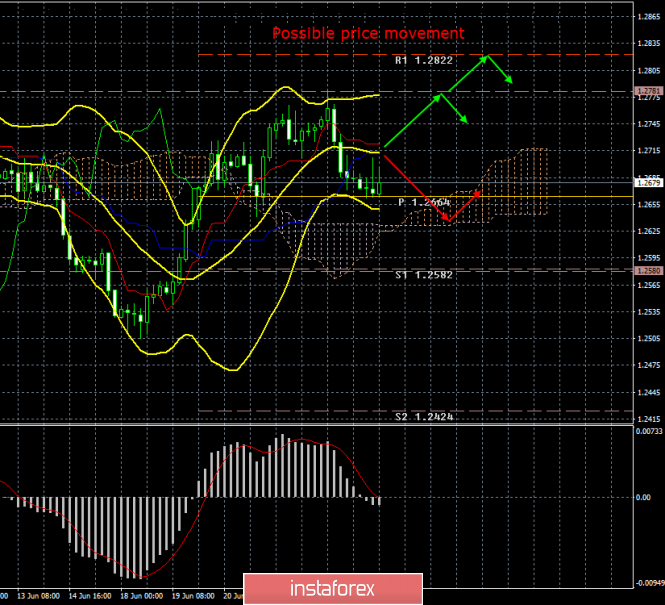
4 hour timeframe

The amplitude of the last 5 days (high-low): 131p - 96p - 104p - 59p - 112p.
Average amplitude for the last 5 days: 100p (90p).
The British pound sterling on Wednesday, June 26, continued a slight downward movement for most of the day, and only during the American trading session the pound began to do a slight growth, as the US failed another macroeconomic report, this time on orders for long-term goods. However, the most interesting information today was related to Boris Johnson, who is the main candidate for the post of prime minister of the country. Johnson, who, incidentally, has not yet won the election, made an official statement in which he urged the European Union to abandon its tough position on the North Irish border. Johnson also said that the UK will not pay 50 billion euros to Brussels unless a new trade agreement is signed. If Brussels does not agree with the requirements of London, then Johnson promised to lead the country according to a "hard" scenario and "come what may", he added. Moreover, this speech by Johnson eclipsed the speech of Mark Carney, who spoke about the monetary policy of the Bank of England. Thus, his speech was much more important for traders than the next attack by Johnson on the EU. Carney said that in the case of "tough" Brexit, all forecasts of economic indicators will be revised, and the regulator will have to stimulate the economy, that is, reduce the key rate. True, the pound sterling also ignored this information, but from a technical point of view, the pound / dollar pair strengthened below the Kijun-Sen line, so the trend for the pair changed to a bearish one. With this reason, the pound has a high chance of heading downwards again.
Trading recommendations:
The currency pair pound / dollar overcame the critical line. Thus, sales of pound sterling with targets are now again relevant to the Senkou Span B line and the support level of 1.2582, but so far, in small lots.
It will be possible to buy the British currency when the pair is fixed above the Kijun-sen line. In this case, the upward trend may resume with the first goal level of 1.2781.
In addition to the technical picture, we should also take into account the fundamental data and the time of their release.
Explanation of the illustration:
Ichimoku indicator:
Tenkan-sen - the red line.
Kijun-sen - the blue line.
Senkou Span A - light brown dotted line.
Senkou Span B - light purple dotted line.
Chinkou Span - green line.
Bollinger Bands indicator:
3 yellow lines.
MACD Indicator:
Red line and histogram with white bars in the indicator window.
The material has been provided by InstaForex Company - www.instaforex.com