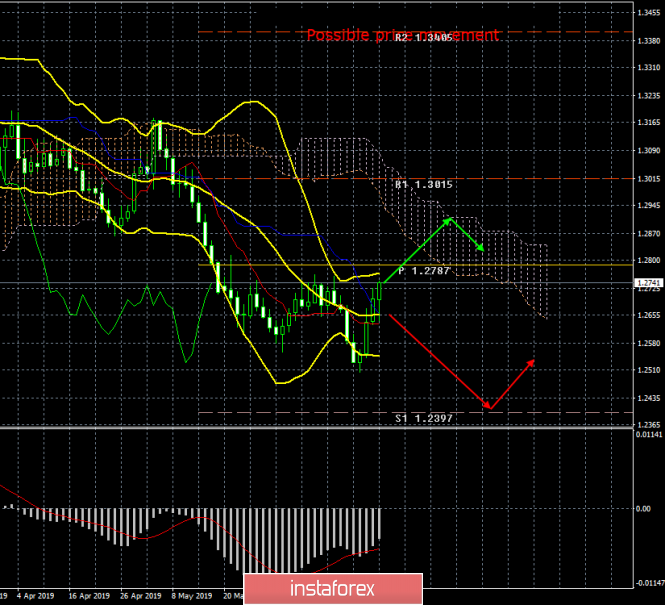
24-hour timeframe

All the attention of traders last week was focused on the meetings of the central banks of the EU, the UK and the US. As a result of the disappointing macroeconomic data from the US in the last three weeks, Jerome Powell's "moderately dovish" rhetoric and the Bank of England's neutrality, which took a wait-and-see attitude, the pound sterling has then managed to rise by around two cents against the US dollar. But the time of important messages from central bank meetings is already in the past, and the foreign exchange market has a question: what is next? We believe that the British currency can be strengthened for some time and this growth can even be worked out, since there is a "golden cross" from Ichimoku on the 4-hour chart, but in the long-term, there are no chances for strong growth in the pound. At least a month is needed for the UK to elect a new prime minister, who will be either Jeremy Hunt or Boris Johnson. The exit of Great Britain from the EU is scheduled for October 31, 2019. This means that the new prime minister will have an entire three months for new negotiations with Brussels (if they will, of course, take place), for a new agreement to be formed, which then will still have to be approved by Parliament. We know how it all happens slowly. The second option is simpler - a "hard" Brexit, but at the same time having serious economic consequences. The British pound with this option can fall down at a terrible speed. In general, support from the UK pound sterling is unlikely to wait in the next month or two. This means there is only hope if further disappointing data from overseas continue to flow. If this is not the case, the bears can return to the market on the pound/dollar pair.
Trading recommendations:
On the 24-hour timeframe, the current upward movement can still be considered as a correction. The nearest target for the purchase of the pound sterling may be the upper limit of the Ichimoku cloud. Sales will again become relevant below the critical line with the aim of the first support level of 1,2397.
In addition to the technical picture should also take into account the fundamental data and the time of their release.
Explanation of the illustration:
Ichimoku indicator:
Tenkan-sen - the red line.
Kijun-sen - the blue line.
Senkou Span A - light brown dotted line.
Senkou Span B - light purple dotted line.
Chikou Span - green line.
Bollinger Bands indicator:
3 yellow lines.
MACD Indicator:
Red line and histogram with white bars in the indicator window.
The material has been provided by InstaForex Company - www.instaforex.com