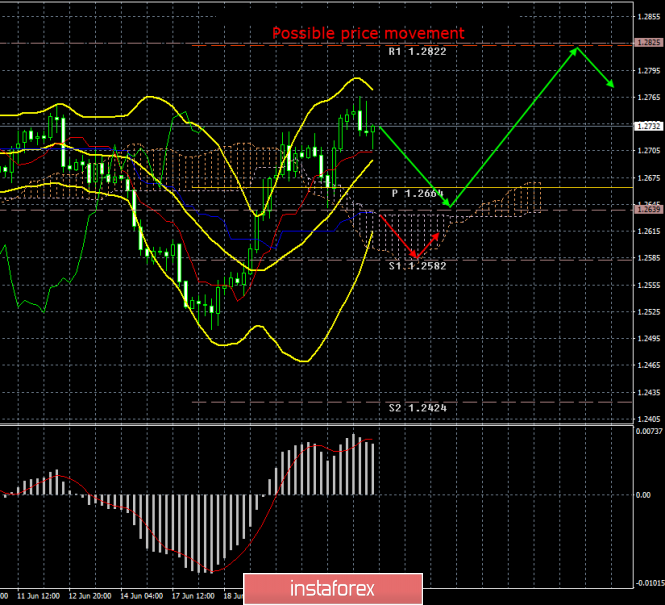
4-hour timeframe

The amplitude of the last 5 days (high-low): 76p - 59p - 131p - 96p - 104p.
Average amplitude for the last 5 days: 93p (93p).
The British pound sterling was slightly adjusted on Monday, June 24. As we remember from the EUR/USD review, there was no correction. Accordingly, this is what we talked about earlier. The situation with Brexit, a political crisis and a hazy future continues to dominate over the pound. That is why the euro can show a strengthening in the future (although its prospects are also not 100%) while the pound can resume a fall. So far, of course, it is still too early to talk about resuming the downward trend, too much negative has come from overseas in recent weeks. Nevertheless, traders are simply afraid to buy the British currency, knowing that the "hard" Brexit is not one of the possible options now, but the most likely option of a "divorce" between the EU and the UK. Firstly, because Boris Johnson is not at all afraid of the "hard" scenario. Secondly, because the European Union officially abandoned new negotiations under the terms of the exit agreement and advised the new prime minister not to waste time on false dreams. New referendum? The probability of holding it is present, especially since Opposition party leader Jeremy Corbyn supports this option. But this also testifies to the fact that even before the proclamation of the new prime minister, we already have a potential split in opinions between the Conservatives and the Laborites. It is because of this that the Parliament can again "slip" at the polls. Recall that the new date Brexit is October 31.
Trading recommendations:
The pound/dollar currency pair started the downward correction, keeping the upward trend. Thus, a rebound from the Kijun-sen line or a reversal of the MACD upwards will make it possible to buy the pound to a resistance level of 1.2822.
It will be possible to buy the US dollar if the pair has consolidated below the Kijun-sen line. In this case, the downward trend may resume with the first target support level of 1.2582.
In addition to the technical picture should also take into account the fundamental data and the time of their release.
Explanation of the illustration:
Ichimoku indicator:
Tenkan-sen - the red line.
Kijun-sen - the blue line.
Senkou Span A - light brown dotted line.
Senkou Span B - light purple dotted line.
Chikou Span - green line.
Bollinger Bands indicator:
3 yellow lines.
MACD Indicator:
Red line and histogram with white bars in the indicator window.
The material has been provided by InstaForex Company - www.instaforex.com