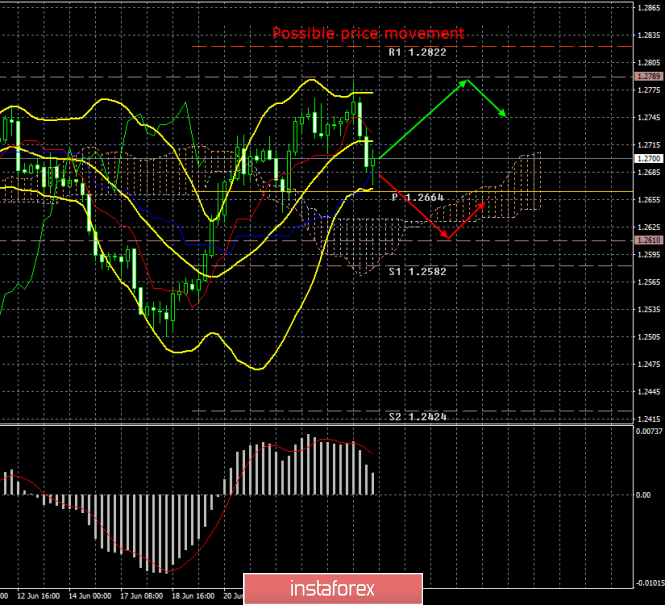
4-hour timeframe

The amplitude of the last 5 days (high-low): 59p - 131p - 96p - 104p - 59p.
Average amplitude for the last 5 days: 90p (93p).
On Tuesday, June 25, the British pound sterling also started to adjust, and the pound/dollar pair worked off the Kijun-sen critical line. Meanwhile, the main candidate for the post of the Conservative Party leader and British prime minister Boris Johnson said that he would lead the country out of the EU before November 1, and no matter in what way. That is, Johnson is mentally prepared for a "hard" Brexit and states that the British government must keep the promise it made to the people. Labour Party leader Jeremy Corbyn is in favor of holding a second referendum, because he believes that negotiations with the EU are stalled, the current agreement does not suit most MPs, a hard Brexit will be destructive for the economy. Parliament rejects May's "deal" and the hard scenario. Johnson also believes that if the new prime minister cannot "translate the dream into reality," that is, implement Brexit before October 31, the consequences will be devastating for both the Conservative Party and the UK. Watching developments in the UK is thus becoming more and more interesting. The pound sterling is the only thing that is sad, which could return to a downward low tomorrow if bears manage to push the critical line on the first attempt. All the chances for this are available. If Jerome Powell doesn't stun the markets with yet more dovish messages tonight, then the pound will not have any special grounds for further growth.
Trading recommendations:
The pound/dollar currency pair started the downward correction, keeping the upward trend. Thus, the rebound from the Kijun-sen line will make it possible to buy the pound again with the target level of 1.2789.
It will be possible to buy the US currency when the pair has consolidated below the Kijun-sen line. In this case, the downward trend may resume with the first targets at the levels of 1.2610 and 1.2582.
In addition to the technical picture should also take into account the fundamental data and the time of their release.
Explanation of the illustration:
Ichimoku indicator:
Tenkan-sen - the red line.
Kijun-sen - the blue line.
Senkou Span A - light brown dotted line.
Senkou Span B - light purple dotted line.
Chikou Span - green line.
Bollinger Bands indicator:
3 yellow lines.
MACD Indicator:
Red line and histogram with white bars in the indicator window.
The material has been provided by InstaForex Company - www.instaforex.com