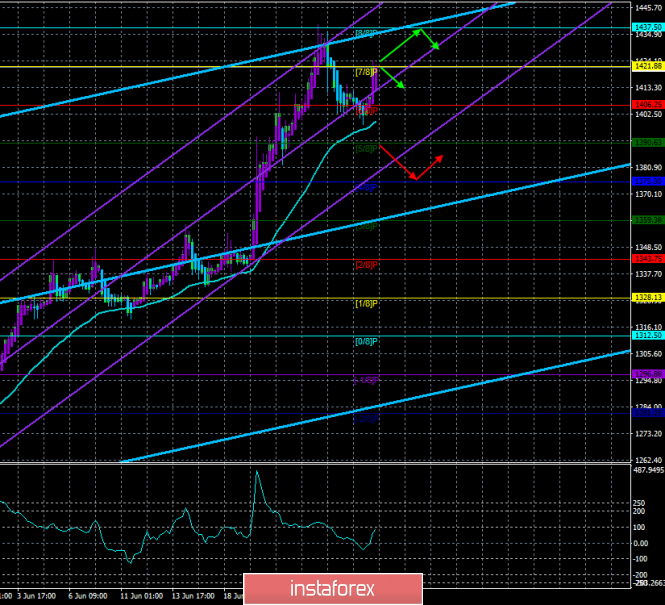
4-hour timeframe

Technical details:
Older linear regression channel: direction - up.
Younger linear regression channel: direction - up.
Moving average (20; smoothed) - up.
CCI: 82.5032
The most famous precious metal in the world failed to reach the moving average line as part of correction by just a few dozen points and completed it. The most interesting thing is that the euro and pound currencies have not shown growth in the last two days. Thus, gold has risen in price and once again, the US dollar did not depreciate. Perhaps, this is the market reaction to the future meeting between Donald Trump and Xi Jinping, which is still known how it will conclude, given the impulsivity of the first and the caution of the second. If the meeting is successful, the demand for gold may weaken as this will mean an increase in the chances of signing a trade deal and end the trade war accordingly. Otherwise, the US dollar may continue to decline against major currencies, while gold will continue to rise. Anyway, now we should wait until the end of the G-20 summit and its results. From a technical point of view, the unambiguous uptrend is maintained for the GOLD instrument, which is evident on both linear regression channels and other technical indicators. Thus, it is not recommended to consider selling instrument below the moving average line before fixing it.
Nearest support levels:
S1 - 1406.25
S2 - 1390.63
S3 - 1375.00
Nearest resistance levels:
R1 - 1,421.88
R2 - 1437.50
R3 - 1453.13
Trading recommendations:
Gold completed a round of downward correction. Thus, it is recommended to trade again for an increase with targets of 1.421.88 and 1.437.50 before the new turn of the Heiken-Ashi indicator is down.
Sell orders will become relevant not earlier than overcoming the moving traders with the first targets of 1375.00 and 1359.38 and small lots since both channels of linear regression are directed upward.
In addition to the technical picture, traders should also take into account the fundamental data and the time of their release.
Explanations for illustrations:
The older linear regression channel is the blue lines of unidirectional movement.
The younger linear regression channel is the violet lines of unidirectional movement.
CCI - blue line in the indicator window.
The moving average (20; smoothed) is the blue line on the price chart.
Murray levels - multi-colored horizontal stripes.
Heiken Ashi is an indicator that colors bars in blue or purple.
The material has been provided by InstaForex Company - www.instaforex.com