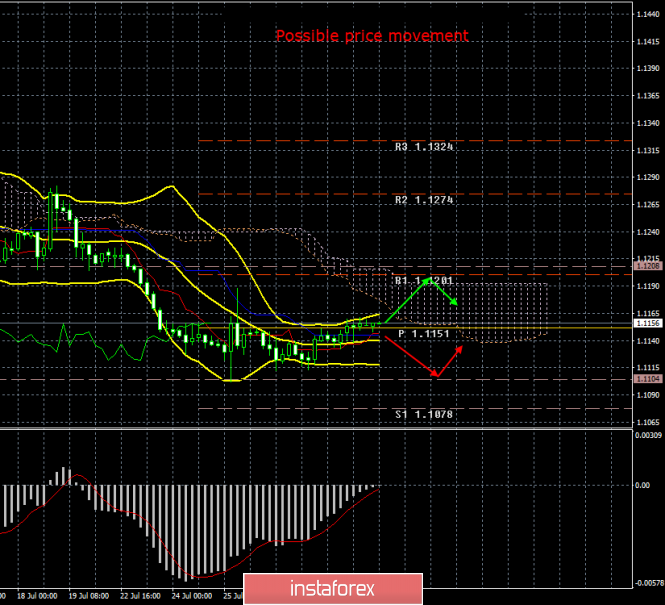
4-hour timeframe

The amplitude of the last 5 days (high-low): 64p - 29p - 86p - 39p - 38p.
Average amplitude for the last 5 days: 51p (47p).
Barely, with grief in half, on Tuesday, July 30, the EUR/USD pair began an upward correction. At the beginning of this week, there were no important macroeconomic publications, so traders are fully focused on the upcoming announcement of the results of the Federal Reserve meeting, which will be held today. Yesterday reports were published on the change in personal incomes and expenditures of the US population, both values increased and coincided with the predicted values. The consumer confidence indicator rose to 135.7 altogether, exceeding the forecast by 10 points at once. However, the forex market still does not force events and waits for the FOMC meeting. A separate topic could be the next round of talks between China and the United States, which also started yesterday in Shanghai. In principle, both sides remain firm with their positions, which they have already reiterated. The United States require a conclusion on the trade deal on their terms and necessarily before Trump's presidency expires. China does not want to be led by Trump, is not going to concede in matters relating to sovereignty and, it seems, is trying to ensure that Trump's term is over. Trump understands where the Chinese side is heading and threatens a tougher deal or the lack of it at all if China deliberately delays the negotiations. However, if China nevertheless reaches the negotiations until 2020, and the next president is not Trump, then the likelihood of a more productive dialogue for China will increase many times. Thus, it is really beneficial for Beijing to delay the negotiations in a covert manner.
Trading recommendations:
EUR/USD has moved to a weak upward correction. Thus, it is now recommended to wait for the MACD indicator to turn down and consolidate the price below the Kijun-sen line and again sell the euro with targets of 1.1104 and 1.1078.
Formally, you can buy the euro/dollar pair now while aiming for the resistance level of 1.1201, but with a short stop, since the results of the Fed meeting could turn out to be a surprise, or just that traders might react to it in a not quite logical way.
In addition to the technical picture should also take into account the fundamental data and the time of their release.
Explanation of the illustration:
Ichimoku indicator:
Tenkan-sen - the red line.
Kijun-sen - the blue line.
Senkou Span A - light brown dotted line.
Senkou Span B - light purple dotted line.
Chikou Span - green line.
Bollinger Bands indicator:
3 yellow lines.
MACD Indicator:
Red line and histogram with white bars in the indicator window.
The material has been provided by InstaForex Company - www.instaforex.com