USD / JPY pair
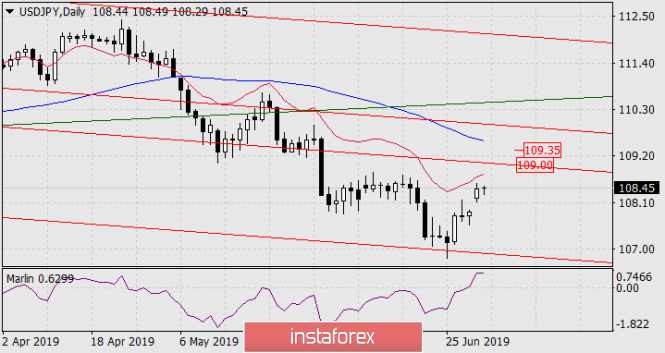
On the daily scale chart, the price rises upward after convergence along with the Marlin oscillator and the signal line moves to the growth zone. However, the price increase turned out to be excessively strong on Monday. Even a gap was formed that greatly complicates the further movement of the currency pair.
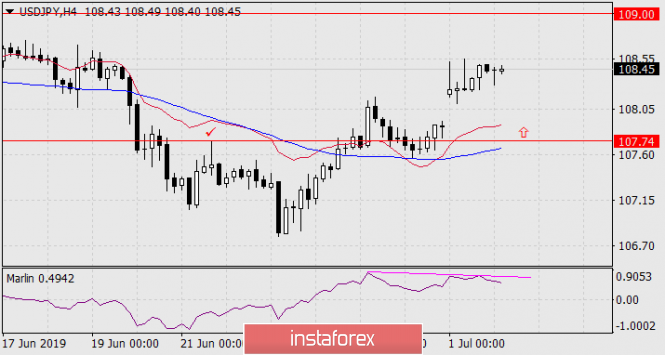
On the four-hour chart, the oscillator divergence is already visible. It forms the following main scenario from current levels. The price decreases to the MACD line on H4 to a maximum on June 21 and then resumes growth to the resistance at 109.00 (to the price channel line) and 109.35 (MACD line) on the daily chart.
After reaching the first goal, the price can close the window (gap) later but the probability of such a scenario is about 20%.


