USD/JPY
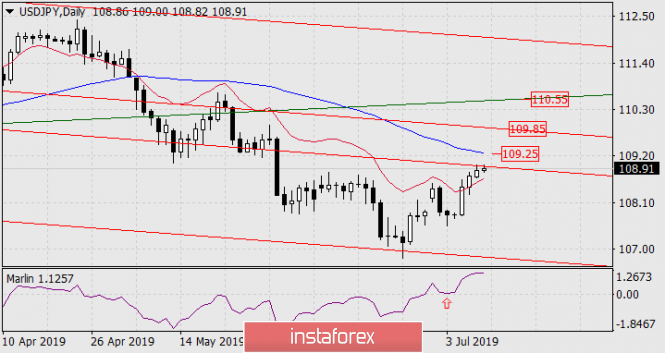
Yesterday and today, the price is testing the strength of the resistance of the embedded line of the price channel at around 109.00. As we expected, the reversal of the signal line of the Marlin oscillator from the border with the territory of the decline on the daily chart took place. Now, the pair USD/JPY needs to overcome this resistance to pass only 25 points to the next resistance on the daily chart – the MACD line, which is an indicator of the current trend.

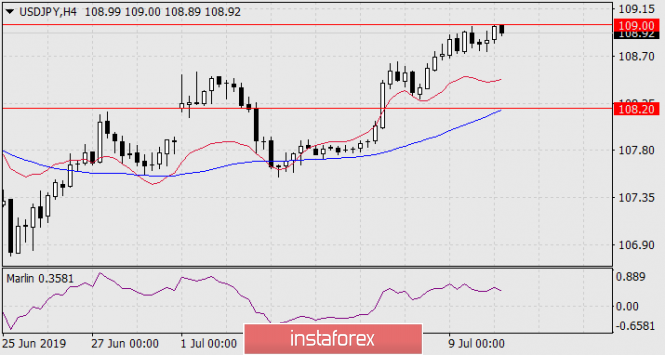
As seen on the four-hour chart, the growth of the Marlin oscillator slowed down, the price may roll back from the current level. But the general upward trend remains stable – the price is above the balance line (red indicator) and the MACD line. The level of 108.20 in this case is not the goal of a possible correction, it marks the "last line of defense" of the bulls. With the departure of the price below this line, a deeper drop is possible.

