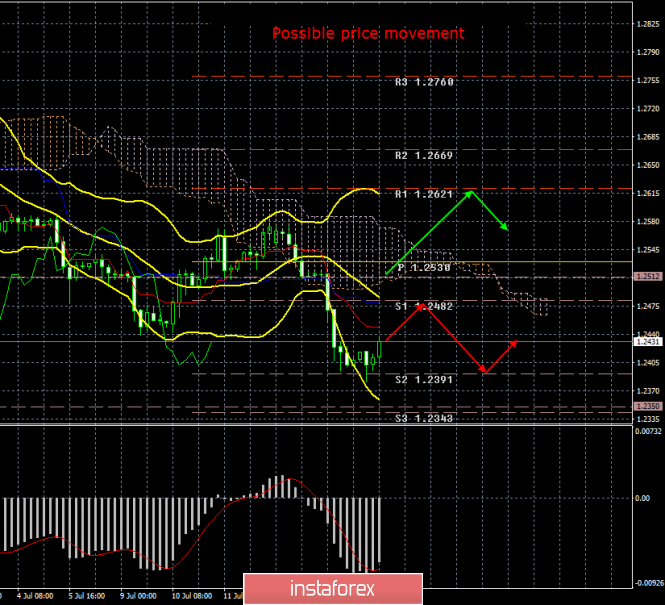
4-hour timeframe

The amplitude of the last 5 days (high-low): 77p - 74p - 60p - 67p - 125p.
Average amplitude over the last 5 days: 81p (72p).
On Wednesday, July 17, the British pound sterling managed without loss against the US currency. Whether the traders are tired of selling the British currency, or decided to take profits on the "dollar" positions, or the market reacted to inflation in the UK, which in June was 2.0% in annual terms and 0.0% in the monthly, so fully consistent with the forecasts of experts. One way or another, the correction has begun for the pound / dollar pair. It is true that the balance of power between the US and UK currencies has not changed a bit. The British currency had a chance to go up when Jerome Powell hinted by all available means that the Fed rate would be lowered in an expected meeting which will be held on July 30-31. And there is no more reason for growth in the pound sterling. Only one factor can be a stretch to bring in a positive British currency. On July 23, the name of the new Prime Minister of the country and the leader of the Conservative Party will be known. It is true that there is every reason to expect no surprises and if Boris Johnson will become the prime minister. There is also every reason to expect that his rhetoric regarding Brexit will not change and he will struggle to push the only possible way out for the UK from the EU on October 31 - without a "deal". And what does it give to the pound sterling? Nothing. The "hard" scenario could hit the pound's position even more, since it means a crushing blow to the UK economy. Even Mark Carney, the head of the British regulator, spoke of this. So it turns out that the pound can only hope that the Fed will begin easing monetary policy at every meeting,
Trading recommendations:
The currency pair pound / dollar began an upward correction. Thus, traders are advised to wait for it to complete and trade again for a fall with the targets of 1.2391 and 1.2350.
It will be possible to buy the British currency after the pair is re-consolidated above the Kijun-Sen line, which will lead to a change of trend to ascending. The targets are the Senkou Span B line and the 1.2621 level.
The fundamental data and the time of their release should also be taken into account in addition to the technical picture.
Explanation of the illustration:
Ichimoku indicator:
Tenkan-sen - red line.
Kijun-sen - blue line.
Senkou Span A - light brown dotted line.
Senkou Span B - light purple dotted line.
Chinkou Span - green line.
Bollinger Bands indicator:
3 yellow lines.
MACD Indicator:
A red line and histogram with white bars in the indicator window.
The material has been provided by InstaForex Company - www.instaforex.com