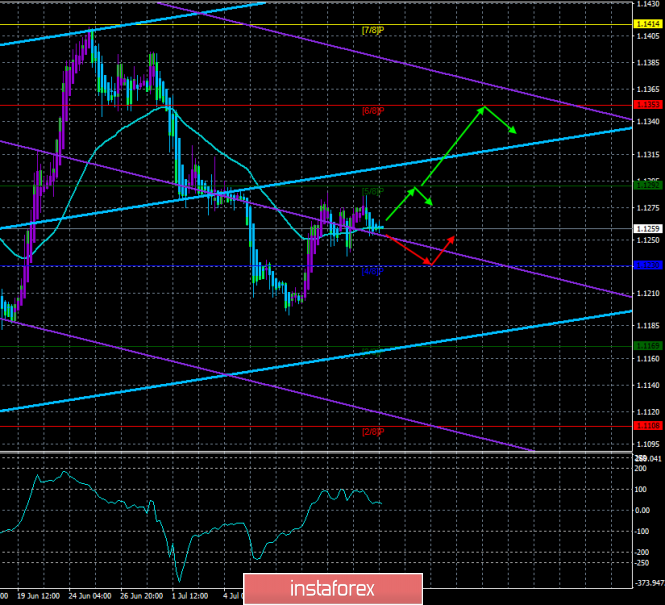
4-hour timeframe

Technical data:
The upper channel of linear regression: direction – up.
The lower channel of linear regression: direction – down.
The moving average (20; smoothed) – sideways.
CCI: 30.3935
The first trading day of the week for the EUR/USD pair ended exactly as it began. The volatility of the pair remained very low, and trading took place near the moving average line, directed to the side. Today, July 16, the next speech of Fed Chairman Jerome Powell will be held, this time at the summit of Finance Ministers and heads of the Central Bank G-7. It is unlikely that Powell's rhetoric will be changed, it is unlikely that the probability of a Fed rate cut in July will decrease, and it is unlikely that traders will react to Powell's speech with dollar sales. Yes, we believe that the Forex market has repeatedly worked out the information that the Fed is ready to lower the key rate in July, and will no longer play it. In addition to Powell's speech, two important macroeconomic reports will be released in the United States today. These are retail sales and industrial production for June. The forecasts are quite low, but still, indicate a minimum increase in both indicators. If in fact, the values are below forecasts, this may cause pressure on the US currency and confirm that the Fed is right in its intention to soften monetary policy. From a technical point of view, the euro/dollar pair once again returned to the moving average and it is clearly visible that it cannot continue to move up.
Nearest support levels:
S1 – 1.1230
S2 – 1.1169
S3 – 1.1108
Nearest resistance levels:
R1 – 1.1292
R2 – 1.1353
R3 – 1.1414
Trading recommendations:
The EUR/USD currency pair continues to be located just above the moving average. Now, therefore, it is recommended to consider the minimum purchase of the euro with the goals of 1.1292 and 1.1353 after the reversal of the indicator Heiken Ashi up.
It is recommended to buy the US dollar after the bears consolidate back below the moving average line, which will change the trend to a downward one, and the targets will be the levels of 1.1230 and 1.1169.
In addition to the technical picture should also take into account the fundamental data and the time of their release.
Explanation of illustrations:
The upper linear regression channel – the blue line of the unidirectional movement.
The lower linear regression channel – the purple line of the unidirectional movement.
CCI – the blue line in the indicator window.
The moving average (20; smoothed) is the blue line on the price chart.
Murray levels – multi-colored horizontal stripes.
Heiken Ashi is an indicator that colors bars in blue or purple.
The material has been provided by InstaForex Company - www.instaforex.com