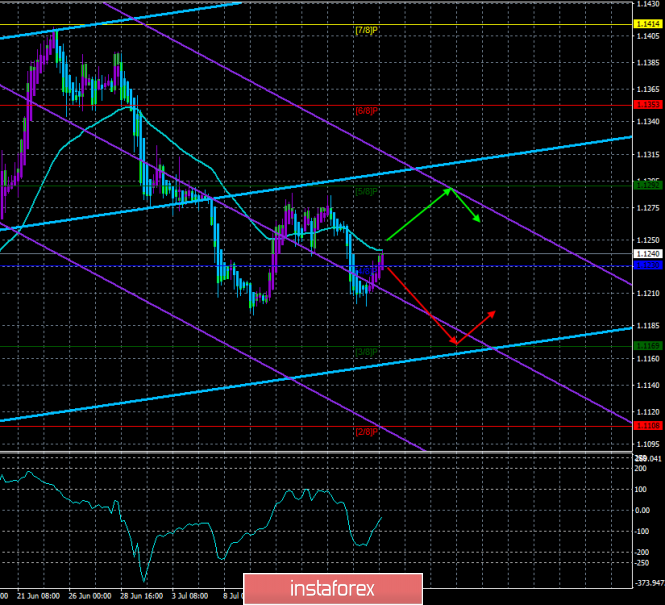
4-hour timeframe

Technical data:
The upper channel of linear regression: direction – up.
The lower channel of linear regression: direction – down.
The moving average (20; smoothed) – sideways.
CCI: -29.2804
On Wednesday, July 17, the EUR/USD pair showed an upward movement with grief in half. The overall strengthening of the euro was about 30 points. It seems that traders have worked out a conditionally positive report on inflation in the European Union for June. At the moment, the euro/dollar pair has adjusted to the moving average line and cannot overcome it yet. The pair's rebound from the moving average can provoke a resumption of the downward movement, and overcoming it will give the bulls a chance to form an upward trend. From a fundamental point of view, Thursday is a very boring day, as no important macroeconomic events are planned for today. Meanwhile, a new scandal involving Donald Trump broke out in America. During one of the interviews, the US President allowed himself to speak unflattering about several democratic women in a racist context, for which he immediately received a portion of criticism. However, the procedure for the removal of the President from his post, initiated by a Congressman from Texas, was immediately blocked by the House of Representatives of the US Congress. Trump himself called this procedure "the funniest project in his life." Thus, traders still had two weak reasons to reduce the "dollar" position. Now, we are waiting for how the market will behave around the MA.
Nearest support levels:
S1 – 1.1169
S2 – 1.1108
S3 – 1.1047
Nearest resistance levels:
R1 – 1.1230
R2 – 1.1292
R3 – 1.1353
Trading recommendations:
The EUR/USD currency pair has adjusted to the moving average. Now, therefore, it is recommended to wait for the price rebound from the moving and re-sell the euro/dollar pair with a target of 1.1169.
It is recommended to buy the euro in small lots if the bulls manage to consolidate above the moving average line, which will change the trend to the upward one, and the target, in this case, will be the level of 1.1292.
In addition to the technical picture should also take into account the fundamental data and the time of their release.
Explanation of illustrations:
The upper linear regression channel – the blue line of the unidirectional movement.
The lower linear regression channel – the purple line of the unidirectional movement.
CCI – the blue line in the indicator window.
The moving average (20; smoothed) is the blue line on the price chart.
Murray levels – multi-colored horizontal stripes.
Heiken Ashi is an indicator that colors bars in blue or purple.
The material has been provided by InstaForex Company - www.instaforex.com