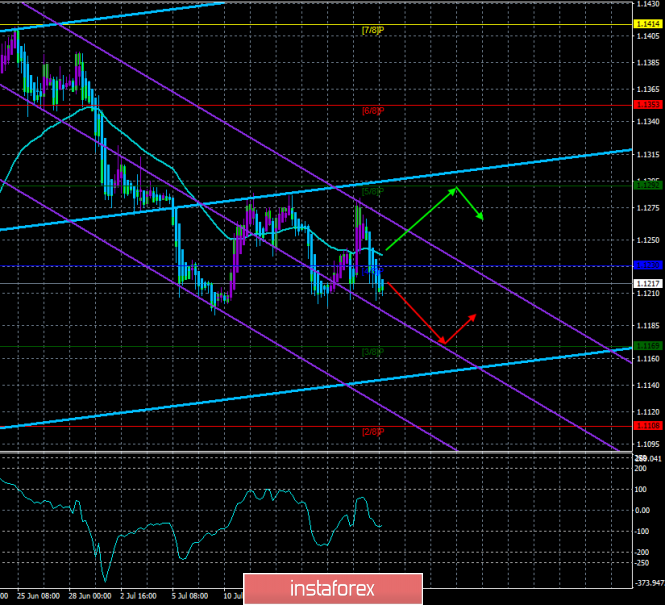
4-hour timeframe

Technical data:
The upper channel of linear regression: direction – up.
The lower channel of linear regression: direction – down.
The moving average (20; smoothed) – sideways.
CCI: -74.1840
The new trading week for the EUR/USD currency pair starts calmly. To date, July 22, no important macroeconomic publications have been planned, so traders will not respond to anything during the day. There are, of course, unexpected news or messages from Donald Trump, but you cannot predict them in advance. As we once again realized last week, the forces of the euro are extremely small, despite the seemingly prosperous time to strengthen. However, we have already written that not everything is as clear as it seems. In our view, the dollar remains stronger and the US economy more powerful. Another overcoming of the MA and makes it more promising to continue the downward trend from a technical point of view. Mario Draghi's rhetoric at the ECB press conference with a probability of 99% will be "dovish". The only question is whether Draghi will announce only a rate cut or also a restart of the QE program, a revision of the inflation target levels? By the way, there have been no surprises from central banks for a long time. For example, everyone expects a decline from the European regulator at the next meeting, and monetary easing may occur as early as Thursday. Thus, we believe that the fall of the euro will continue this week.
Nearest support levels:
S1 – 1.1169
S2 – 1.1108
S3 – 1.1047
Nearest resistance levels:
R1 – 1.1230
R2 – 1.1292
R3 – 1.1353
Trading recommendations:
The EUR/USD currency pair is fixed below the moving average. Now, therefore, it is recommended to sell the euro/dollar pair with a target of 1.1169 before the reversal of the Heiken Ashi indicator to the top.
It is recommended to buy the euro in small lots if the bulls manage to return the pair above the moving average line, which will change the trend to the upward one, and the target, in this case, will be the level of 1.1292.
In addition to the technical picture should also take into account the fundamental data and the time of their release.
Explanation of illustrations:
The upper linear regression channel – the blue line of the unidirectional movement.
The lower linear regression channel – the purple line of the unidirectional movement.
CCI – the blue line in the indicator window.
The moving average (20; smoothed) is the blue line on the price chart.
Murray levels – multi-colored horizontal stripes.
Heiken Ashi is an indicator that colors bars in blue or purple.
The material has been provided by InstaForex Company - www.instaforex.com