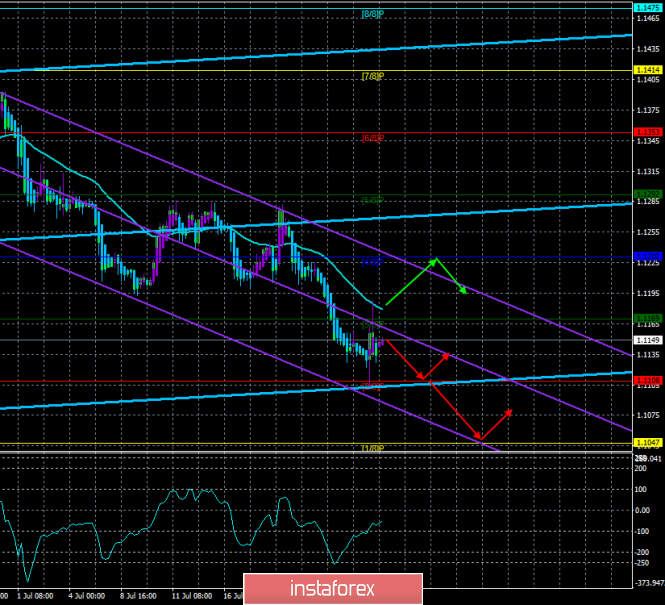
4-hour timeframe

Technical data:
The upper channel of linear regression: direction – up.
The lower channel of linear regression: direction – down.
The moving average (20; smoothed) – down.
CCI: -53.9693
The results of the meeting of the ECB Monetary Committee were extremely predictable. Rates have remained unchanged, and Mario Draghi's speech at the press conference was terribly similar to his previous performances. Draghi noted the slowing inflation again, falling rates of economic growth and linked it all with the tense situation in the world, trade wars and threats from protectionism. At first, traders didn't expect that there would be no rate cut right now, or hoped to hear more direct hints of easing monetary policy at the next meeting, but they even began to close dollar positions, which led to a slight strengthening of the euro. However, happiness for the euro did not last long. The euro/dollar pair managed to adjust to the moving average line, but it was followed by a rebound, so the downward trend remains. At the moment, the indicator Heiken Ashi colors bars in purple, which indicates an upward trend of intraday, but it is more like a round of correction. Today, July 26, we draw traders' attention to the publication of preliminary data on US GDP for the second quarter. This week, there were only US reports, and next week, all attention will be focused on the Fed, which for the first time in a long time can lower the key rate. According to experts' forecasts, GDP in the second quarter can significantly decrease, but if it is higher than forecasts, it will support the dollar.
Nearest support levels:
S1 – 1.1108
S2 – 1.1047
S3 – 1.0986
Nearest resistance levels:
R1 – 1.1169
R2 – 1.1230
R3 – 1.1292
Trading recommendations:
The EUR/USD currency pair started to adjust. On July 26, therefore, it is recommended to wait for the turn of Heiken Ashi down and sell the euro/dollar pair with a target of 1.1108, which has already been worked out.
It is recommended to buy the euro in small lots if the bulls manage to return the pair above the moving average line, which will change the trend to the upward one, and the first goal, in this case, will be the Murray level of "4/8" - 1.1230.
In addition to the technical picture should also take into account the fundamental data and the time of their release.
Explanation of illustrations:
The upper linear regression channel – the blue line of the unidirectional movement.
The lower linear regression channel – the purple line of the unidirectional movement.
CCI – the blue line in the indicator window.
The moving average (20; smoothed) is the blue line on the price chart.
Murray levels – multi-colored horizontal stripes.
Heiken Ashi is an indicator that colors bars in blue or purple.
The material has been provided by InstaForex Company - www.instaforex.com