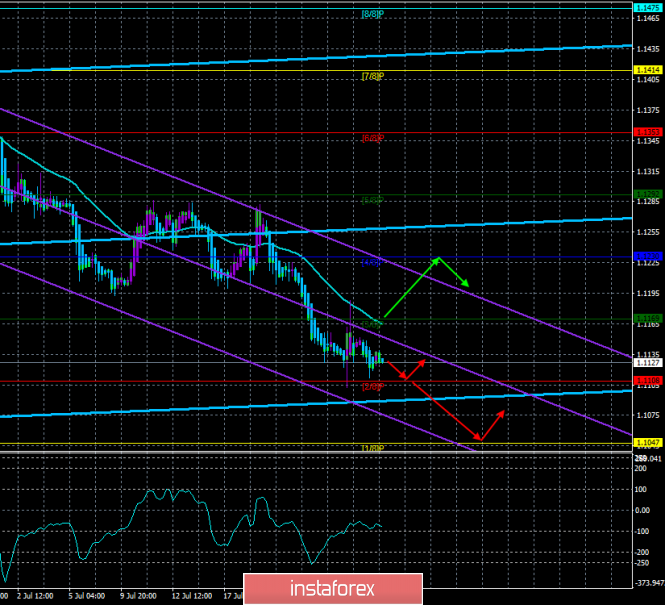
4-hour timeframe

Technical data:
The upper channel of linear regression: direction – up.
The lower channel of linear regression: direction – down.
The moving average (20; smoothed) – down.
CCI: -80.7527
Last week was completely under the flag of the ECB. At the beginning of the week, traders tried to predict the actions of the European regulator and the rhetoric of Mario Draghi, in the middle of the week – worked out the results of the meeting and drew attention to the States and their GDP. This week promises to be no less interesting, but, unfortunately, there is little intrigue among market participants. With a probability of 90%, the Fed is likely to reduce the key rate by 0.25% and this decision of the regulator is likely already taken into account in current prices. First, the regulator may not soften monetary policy right now, after all, the latest macroeconomic reports on GDP and Nonfarm Payrolls were quite good. Secondly, the regulator can ignore these statistics and reduce the key rate by 0.5% at once, thus playing "ahead of the curve". However, we believe that the probability of execution of each of these options does not exceed 5%. On Monday, July 29, no important macroeconomic publications will be available to traders, the calendars of the US and the European Union are absolutely empty. Thus, we cannot count on high volatility today. Technically, the euro/dollar pair continues to trade around two-year lows, having all chances to continue the downward trend.
Nearest support levels:
S1 – 1.1108
S2 – 1.1047
S3 – 1.0986
Nearest resistance levels:
R1 – 1.1169
R2 – 1.1230
R3 – 1.1292
Trading recommendations:
The EUR/USD currency pair resumed its downward movement. On 29 July, therefore, it is recommended to continue selling the pair EUR/USD with targets at 1.108 and 1.1047 to the reversal indicator Heiken Ashi up.
It is recommended to buy the euro in small lots if the bulls manage to return above the moving average line, which will change the trend to the upward one, and the first goal, in this case, will be the Murray level of "4/8" - 1.1230.
In addition to the technical picture should also take into account the fundamental data and the time of their release.
Explanation of illustrations:
The upper linear regression channel – the blue line of the unidirectional movement.
The lower linear regression channel – the purple line of the unidirectional movement.
CCI – the blue line in the indicator window.
The moving average (20; smoothed) is the blue line on the price chart.
Murray levels – multi-colored horizontal stripes.
Heiken Ashi is an indicator that colors bars in blue or purple.
The material has been provided by InstaForex Company - www.instaforex.com