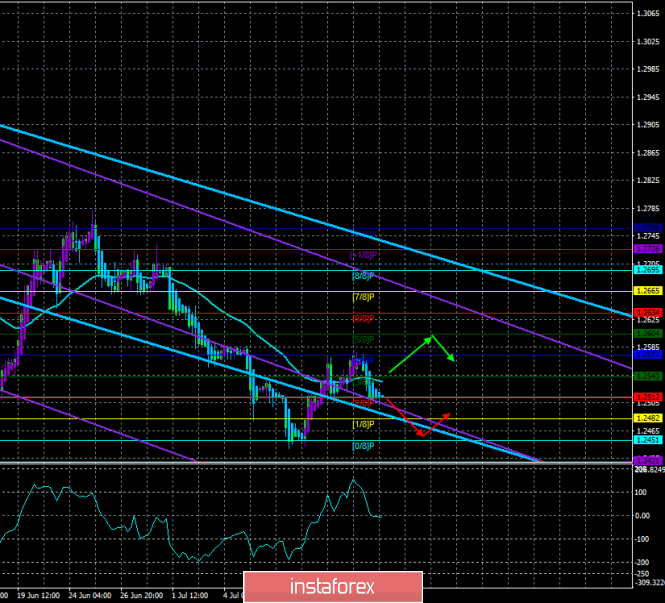
4-hour timeframe

Technical data:
The upper linear regression channel: direction – down.
The lower linear regression channel: direction – down.
The moving average (20; smoothed) – sideways.
CCI: -8.6999
The British pound spent about two days above the MA, once again showed its inability to grow and returned to the area below the MA. Thus, now we can state the resumption of the downward trend, and to all the fundamental reasons for the fall of the pound, technical ones are added. The prospects for the British currency remain extremely rosy. Even when Jerome Powell spoke in Congress, hinting at a preventive reduction in the key rate in July, the pound is not that much more expensive. All the leaders and heads of key departments of the European Union said that the current version of the "deal" on Brexit will not be reviewed, so all the threats of Boris Johnson and Jeremy Hunt to leave the EU on the "hard" scenario did not seem to frighten Brussels too much. Moreover, the EU does not want to lose the UK and is well aware that the new negotiations, the best conditions for London will lead to its exit from the EU. And with the current version of the "deal" that does not suit the Parliament, there are options. For example, Laborists will still push the scenario with the second referendum. Today in the UK, Governor of the Bank of England Mark Carney will deliver a speech, as well as reports on unemployment and changes in average wages will be published. This news may "help" the pound sterling to continue falling.
Nearest support levels:
S1 – 1.2512
S2 – 1.2482
S3 – 1.2451
Nearest resistance levels:
R1 – 1.2543
R2 – 1.2573
R3 – 1.2604
Trading recommendations:
The currency pair GBP/USD pair fixed back below the MA. Thus, it is now recommended to sell the pound with the closest targets at 1.2482 and 1.2451.
It will be possible to buy the pound/dollar pair with the targets of 1.2573 and 1.2604 after fixing the price back above the moving average line, but with the minimum lots.
In addition to the technical picture should also take into account the fundamental data and the time of their release.
Explanation of illustrations:
The upper linear regression channel – the blue line of the unidirectional movement.
The lower linear regression channel – the purple line of the unidirectional movement.
CCI – the blue line in the indicator regression window.
The moving average (20; smoothed) is the blue line on the price chart.
Murray levels – multi-colored horizontal stripes.
Heiken Ashi is an indicator that colors bars in blue or purple.
The material has been provided by InstaForex Company - www.instaforex.com