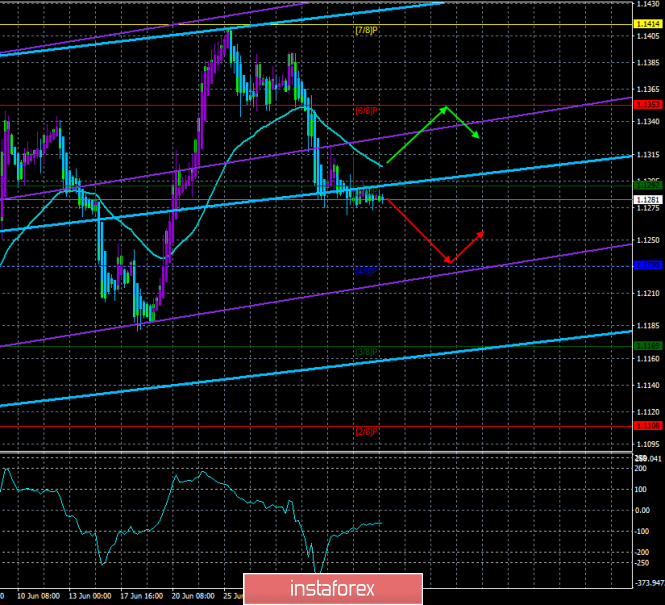
4 hour timeframe

Technical data:
The upper linear regression channel: direction - up.
The lower linear regression channel: direction - up.
Moving average (20; smoothed) - down.
CCI: -61.1428
On Friday, July 5, the EUR / USD pair is no longer continuing its low-volatility movement. It simply "stuck" to the price range of 1.1275 - 1.1290. There is no demand for any of the currencies now, but there is a complete balance between the bulls and bears. Yesterday's market behavior and its total amorphousness is easily explained by the Independence Day in the USA. This is despite the unexpected action of the European markets to join in the American holiday celebrations. Today, the forex market should wake up because a large package of important macroeconomic information is expected to arrive from overseas today. First, the unemployment rate for June will be published. Second, the wages for June, and third, the number of new jobs created outside the agricultural sector, the so-called Nonfarm Payrolls. If the first two reports are clear, Nonfarm often leads to a contradiction from traders. For several times, there was no reaction at all. It is more often than not that the reaction was opposite to what would be considered logical. In general, there are problems with this report. Today, this report will have to tell traders whether to continue buying US dollars, and the Fed - whether to continue with softening the monetary policy in the next 3 months. It is clear that future FOMC decisions will not depend on this report alone, but it is from these reports that the overall economic picture is formed.
Nearest support levels:
S1 - 1.1230
S2 - 1.1169
S3 - 1.1108
Nearest resistance levels:
R1 - 1,1292
R2 - 1.1353
R3 - 1,1414
Trading recommendations:
The EUR / USD currency pair continues its downward movement and maintains the downward trend. Thus, now, it is recommended to continue trading on the decline to the goal of Murray's "4/8" level - 1.1230 until the Heiken-Ashi indicator turns up.
It is recommended to buy the Eurocurrency after traders consolidate back above the moving average line, which will change the trend an upward one, with the first goal of 1.1353.
In addition to the technical picture, the fundamental data and the time of their release should also be taken into account.
Explanations for illustrations:
The upper linear regression channel - the blue line of the unidirectional movement.
The lower linear regression channel - the violet line of the unidirectional movement.
CCI - blue line in the indicator regression window.
The moving average (20; smoothed) is the blue line on the price chart.
Murray levels - multi-colored horizontal stripes.
Heiken Ashi is an indicator that colors bars in blue or purple.
The material has been provided by InstaForex Company - www.instaforex.com