Thursday's macroeconomic reporting included statistics on retail sales in the United States, which certainly supported interest in the US currency. The volume of retail sales in monthly terms increased by 0.7%, indicators for June were revised for the worse 0.4% ----> 0.3%. It is worth considering that this indicator is one of the most important indicators of the state of the economy of the United States, since consumer spending accounts for about 70% of the country's GDP. As a result, the inertial move on the dollar continued, amid the positive US statistics and the aggravating situation in Europe.
Today, in terms of macroeconomic reporting, we have data on the construction sector in the United States, where a slight increase is expected. So, a building permit for July expects an increase from 1,220M to 1,270M, and the volume of construction of new houses shows an increase of 1,253M ----> 1,257M.
USA 12:30 London time. - Building Permits, July: Prev 1,220M ----> Prog. 1,270M
USA 12:30 London time. - Started construction of houses for July: Prev 1,253M ----> Prog. 1,257M

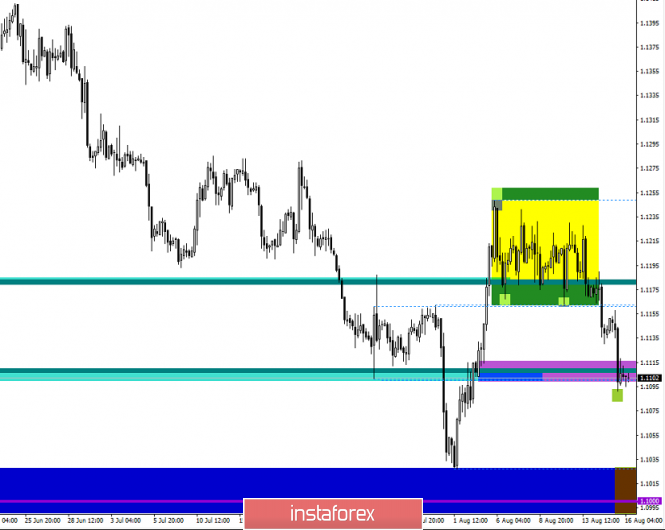
In the end, the EUR/USD pair managed to overcome the shaded side channel of 1.1180/1.1250, breaking through the lower boundary and rushing into the inertial stroke. Considering everything that happens in general terms, we see that the direction of the quote was chosen in the direction of the main trend, which is a good sign for many traders who worked on the decline. The temporary stopping point, relative to the current time, is the level of 1,1100, where a temporary stagnation is formed in the form of Doji candles.
It is likely to assume that the current stagnation/retracement, to some extent associated with the overheating of short positions, will serve as a regrouping of trading forces, but the incentive for a further decline is still on the market.
Specifying all of the above in trading signals:
We consider long positions in terms of a corrective move, where in case of price consolidation higher than 1.1120, you can consider the move to 1.1150.
We consider short positions in terms of the continuation of the inertial course, after a temporary stop, where positions will be considered below the current low of 1.1090-1.1080. The prospect of a fall is the band of the psychological level of 1.1000 (+/- 30 points).
From the point of view of the comprehensive indicator analysis, we see that the indicators on the minute passes have alternately taken an upward position due to the stop. Global time periods coupled with intraday ones are focused on further decline.

