AUD / USD pair
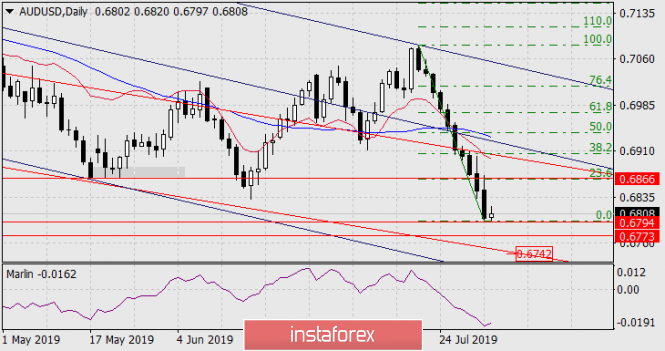
The Australian dollar has been falling for ten days in a row. Marlin's line oscillator has drawn a flat line up to the oversold zone itself, only this visual pattern is enough to consider the options for correction. The price yesterday stopped at almost the minimum of May 2004 at 0.6794 and taking into account quotation errors for 15 years, we can accept the achievement of this level. Our target of 0.6742 can be achieved after a correction from the whole 10-day decline of the "Aussie".

But today, good data on employment in the US is expected. The forecast for new jobs in the non-agricultural sector in July is 164 thousand and a decrease in unemployment from 3.7% to 3.6%. If the data do not fail, it is likely to work out the range of 0.6773/94, the lower limit of which will be at least June 2014 (and the lowest point in the next 3 years).
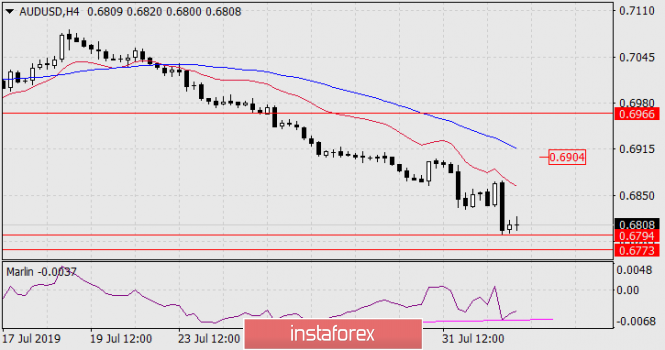
On the four-hour chart, there was a weak convergence in Marlin, while converting the price to the target range, convergence may become more convincing.

The potential correction at the moment is determined by the Fibonacci level of 23.6% of the 10-day price reduction. This level coincides with the May 15, 21 and 23 minima at 0.6866. The first growth target will be the MACD line in the area of 0.6904 on H4. We are waiting for the development of events since the price can drop for 11 and 12 days.
The material has been provided by InstaForex Company - www.instaforex.com