AUD/USD
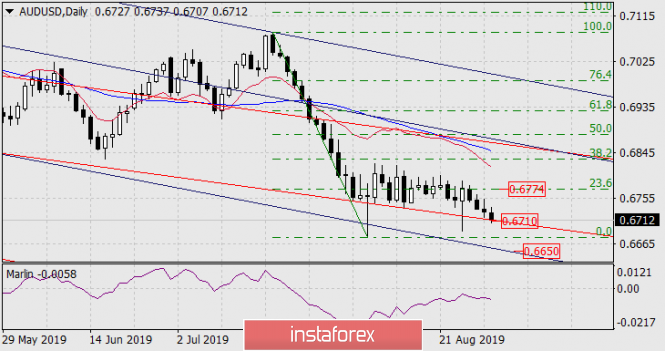
For four days of decline, the Australian dollar has come a short way from the Fibonacci level of 23.6% on the daily chart to support the embedded line of the red price channel on a monthly scale (0.6710). The market's first attempt to overcome this support was on August 7, but it was on an exhausted two-week movement, the second attempt was on August 26, now the third attempt, which is 80% statistically successful. The Marlin oscillator on the daily low is falling slightly, there is a reserve for medium-term decline. The first goal is to support the blue price channel in the region of 0.6650.

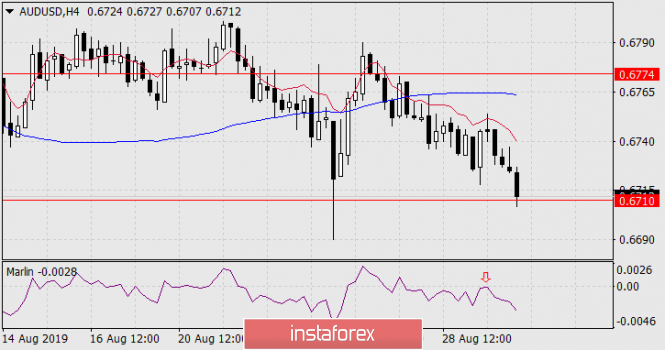
On a four-hour chart, the price falls below the lines of balance (red indicator) and MACD (blue indicator), the Marlin decreases after a reversal from the boundary with the growth territory.

