EUR / USD pair
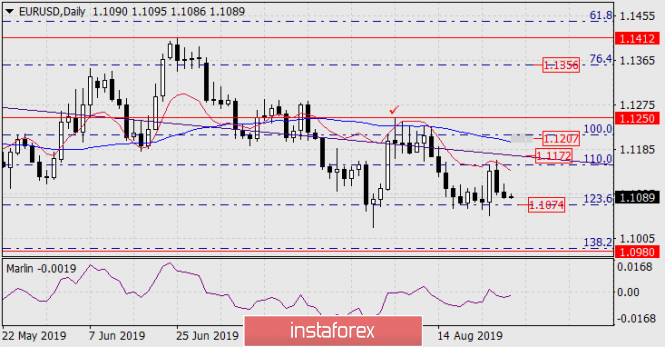
On Tuesday, the euro fell by 10 points, which technically allowed the indicators to clarify their intentions without pressure. The leading Marlin oscillator on the daily chart is fixed in the zone of negative values.

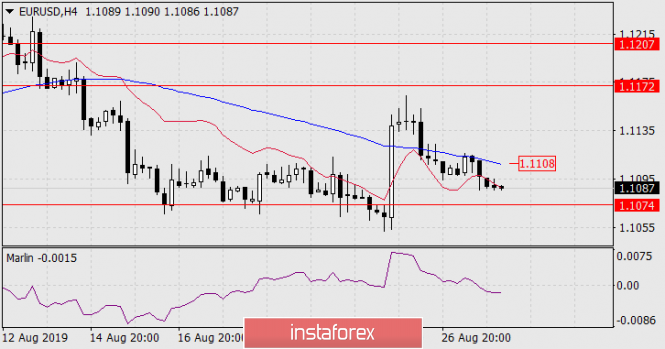
On the four-hour chart, the price was reflected from the resistance of the MACD line, which is currently developing below the red indicator line of balance. The Marlin Oscillator also fixed in the zone of a declining trend. Now, you need to gain a foothold under the Fibonacci line of 123.6% found below the price of 1.1074 in order to create a signal in the medium-term decline in price. After this signal, we expect the price in the region of the Fibonacci level of 138.2% at the price of 1.0980 and this is the main scenario.

If the price fixes above the MACD line at 1.1108 on H4, another attempt to take the resistance price of the embedded line of the price channel in the region of 1.1172 is possible.
The material has been provided by InstaForex Company - www.instaforex.com