EUR/USD
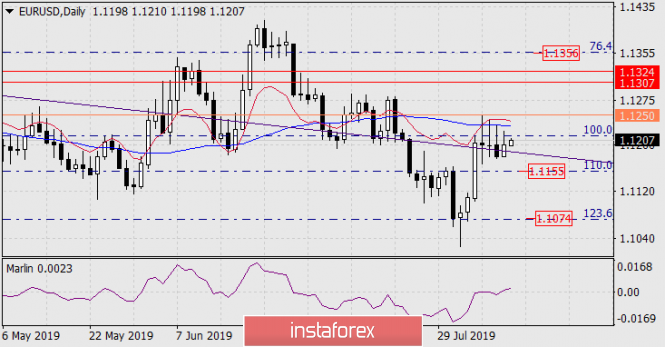
On Friday, the euro closed at the opening level of Thursday, the growth attempt was stopped at the Fibonacci level of 100.0% (minimum of November 12, 2018). On the daily scale chart, the price is between the price channel line and the Fibonacci level of 100%. Fixing above one of these levels will determine a short-term movement for one or two days, and the rising movement has a limit to the level of 1.1250 – to a maximum on August 6 near the MACD line (blue indicator, which the price could not overcome with three attempts). The downward movement after the consolidation under the Fibonacci level of 110.0% (1.1155) developing a medium-term decrease in the short and intermediate target of 1.1074 (Fibonacci 123.6%), then the Fibonacci target will be worked out at 123.6% at a price of 1.1074.

On Tuesday, the eurozone ZEW sentiment indices come out, forecasts for them are pessimistic: the indicator of sentiment in the business community of Germany for August is expected to fall from -34.5 to -27.8, the forecast for the eurozone is -21.7 against -20.3 months earlier.
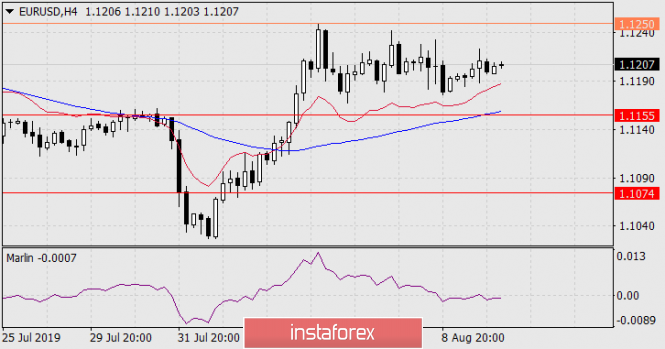
As seen on the four-hour chart, the price continues to drift over the balance and MACD lines, the Marlin oscillator is tired of waiting and has changed into a downward trend. Tomorrow is likely to be the decisive day.

