EUR/USD
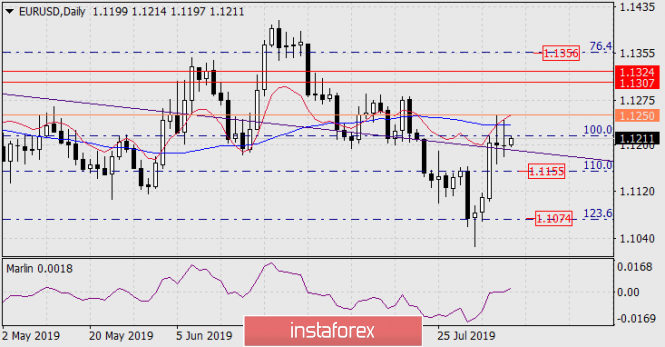
Yesterday, the euro was similar to the previous one - the average volatility with a range of more than 60 points and the closing of the day was almost at the opening level. The price line was also resisted by the balance and MACD line of the daily scale, and the embedded line of the price channel of this scale supported the line. Today, the Marlin Oscillator signal line deviated upward from the boundary dividing the growth zone trends from the decline zone.

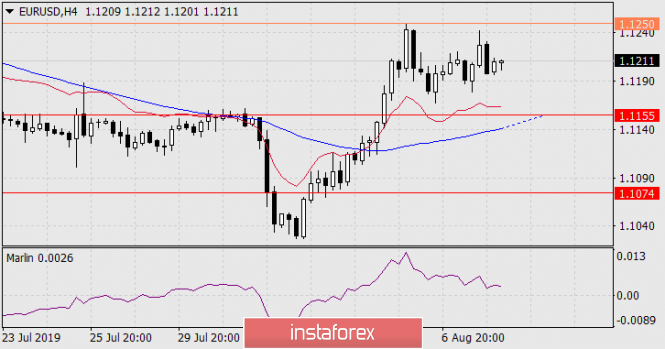
On the four-hour chart, the Marlin signal line slowed down, taking into account the indications of a larger scale, it is possible to turn up and on H4. For the price, this can be technical support to overcome the 1.1250 benchmark (the top on August 6), and then the price can go straight to the target range of 1.1307/24.

In order to develop a downward movement, the price should be consolidated below the trend line of the price channel of the daily chart and even go below the first target of 1.1155, as the MACD line is already approaching it on the four-hour chart, which will strengthen this support. Overcoming the price of 1.1155 opens the way to 1.1074 - to the Fibonacci level of 123.6% of daily TF. The likelihood of a rising and falling scenario offsets.
The material has been provided by InstaForex Company - www.instaforex.com