GBP/USD
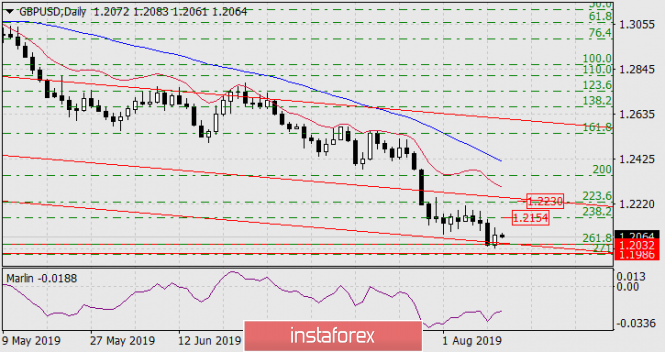
On Monday, the pound sterling slightly adjusted the top from strong technical support of the range of 1.1986-1.2032, corresponding to the lows of January 2017 and October 2016, and coinciding with the Fibonacci levels of the daily chart of 271.0% and 261.8%.

Convergence on the Marlin oscillator formed on the daily chart. Whether this pattern turns out to be a sign of a deeper correction, to the Fibonacci levels of 238.2%, at the price of 1.2154 or 223.6% at the price of 1.2230, or will it turn out to be a false signal and the price will consolidate at 1.1986, it will become clear either today after the release of data on employment in the UK or tomorrow, with the release of inflation indicators. According to today's data, the unemployment rate is expected to remain unchanged at 3.8%, applications for unemployment benefits in July may be slightly less than in the previous month - 32.0 thousand against 38.0 thousand. Inflation forecasts on Wednesday are negative, in particular CPI may drop from 2.0% y/y to 1.9% y/y.

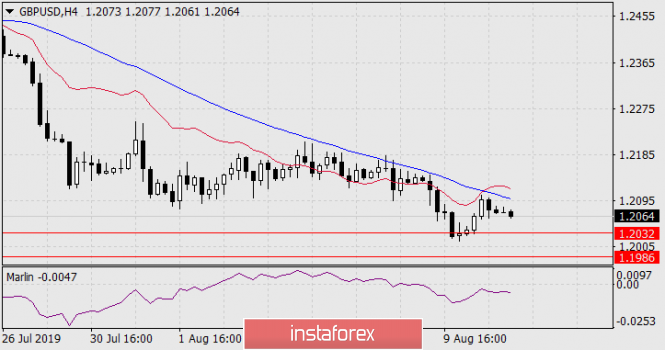
On the four-hour chart, the price is steadily falling below the blue MACD indicator line, while the Marlin oscillator is in the decline zone. The current situation is neutral, we are waiting for the development of events.
The material has been provided by InstaForex Company - www.instaforex.com