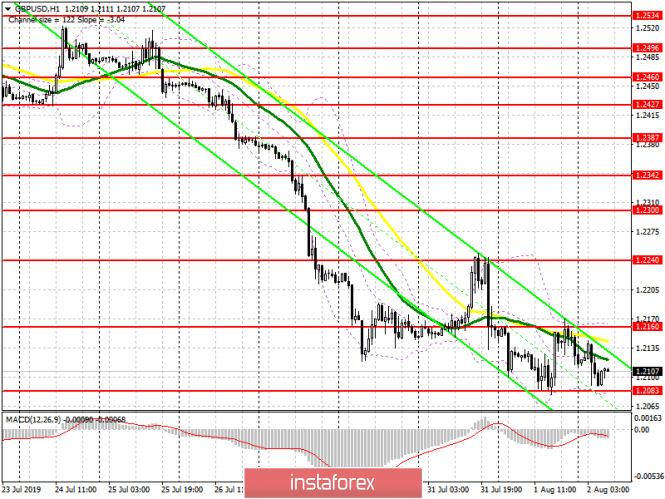
To open long positions on GBP/USD you need:
Despite the pound's attempt to form a correctional wave of growth in the second half of the day after a weak report on manufacturing activity in the US, buyers did not manage to get above the important resistance level of 1.2160, to which I repeatedly paid attention to. At the moment, given that a report on the US labor market is being released today, bulls are required to keep the level of 1.2083 in the first half of the day, forming a false breakdown on which will allow us to rely on a repeated upward correction to the resistance area of 1.2160, where I recommend taking profits. Consolidation above this range, after weak data on unemployment in the US, will make it possible for us to start a conversation on the topic of the pound's continued growth in the region of a high of 1.2240. In case GBP/USD further declines, it is best to look closely at long positions from lows of 1.2040 and 1.1985.
To open short positions on GBP/USD you need:
For the third time, sellers have set their sights on support around 1.2083, a breakthrough of which will only strengthen the bearish trend and lead to an update of 1.2083 and 1.2040 lows, where I recommend taking profits. However, one should not forget that data on the US labor market may affect traders, and a weak report on the number of people employed in the non-agricultural sector may force a profit in the US dollar, which will lead to an upward correction in GBP/USD. In this scenario, it is best to rely on short positions after the formation of a false breakdown in the resistance area of 1.2160 or to sell the pound from a high of 1.2240, which was formed earlier this week.
Indicator signals:
Moving averages
Trading is below 30 and 50 moving averages, which indicates the prevalence of pound sellers in the market.
Bollinger bands
In case the pound falls, support will be provided by the lower limit of the indicator in the region of 1.2083. The upward correction will be limited by the upper line of the indicator in the area of 1.2160.

Description of indicators
- MA (moving average) 50 days - yellow
- MA (moving average) 30 days - green
- MACD: fast EMA 12, slow EMA 26, SMA 9
- Bollinger Bands 20
