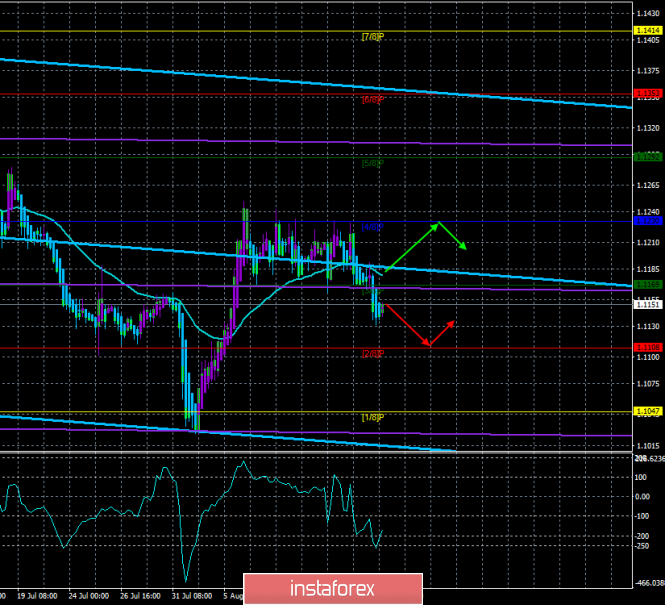
4-hour timeframe

Technical data:
The upper linear regression channel: direction – down.
The lower linear regression channel: direction – sideways.
The moving average (20; smoothed) – down.
CCI: -139.1804
The EUR/USD currency pair resumed its downward movement on August 15 after a series of unsuccessful attempts to overcome the Murray level of "4/8", as well as after the next "excellent" macroeconomic reports from the eurozone. Industrial production in Europe fell by 2.6% y/y and traders did not even react to this news but the sale of the euro/dollar pair still began. The technical picture indicates a downward movement, as the pair failed to update the previous local maximum (1.1283), most of the indicators are directed downwards. From a fundamental point of view, the situation also remains in favor of the US currency, as we do not receive any positive news from Europe. In the United States, reports on the changes in industrial production for July with a forecast of +0.2% m/m and retail sales for July with a forecast of +0.3% m/m will be published today. In principle, there is no particular reason to expect the failure of these reports, so the dollar may receive support at the American trading session. Otherwise, there are no new and interesting events in America and Europe now. Trump continues to fight with China, Europe continues to fight the Italian crisis and is preparing for a "divorce" from the UK. Both regulators, the Fed and the ECB, are preparing to ease monetary policy.
Nearest support levels:
S1 – 1.1108
S2 – 1.1047
S3 – 1.0986
Nearest resistance levels:
R1 – 1.1169
R2 – 1.1230
R3 – 1.1292
Trading recommendations:
The euro/dollar pair ended the flat and resumed its downward movement. Thus, it is recommended to buy the American currency with targets at 1.1108 and 1.1047 before the Heiken Ashi indicator turns up, which will indicate a round of upward correction.
In addition to the technical picture, you should also take into account the fundamental data and the time of their release.
Explanation of illustrations:
The upper linear regression channel – the blue line of the unidirectional movement.
The lower linear regression channel – the purple line of the unidirectional movement.
CCI – the blue line in the indicator window.
The moving average (20; smoothed) – blue line on the price chart.
Murray levels – multi-colored horizontal stripes.
Heiken Ashi is an indicator that colors bars in blue or purple.
The material has been provided by InstaForex Company - www.instaforex.com