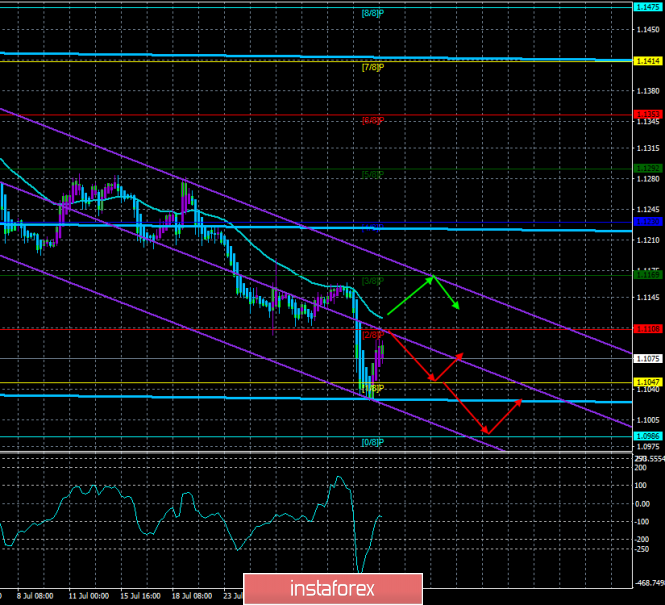
4-hour timeframe

Technical data:
The upper linear regression channel: direction – sideways.
The lower linear regression channel: direction – down.
The moving average (20; smoothed) – down.
CCI: -77.2485
Due to not the best indicators of business activity in the US manufacturing sector, as well as the technical need for correction, the pair started moving to the moving average line on August 1. On the last trading day of the week, traders will receive a very large package of macroeconomic information. From the eurozone will come information on retail sales for June, in America – the unemployment rate, the change in average hourly wages, Nonfarm Payrolls and consumer confidence index from the University of Michigan will be published. In general, all forecasts are at a high level and, if the real values of these indicators do not disappoint traders, the US dollar may once again be popular. In any case, the downward trend in the euro/dollar pair is still maintained. The fate of the US currency will also largely depend on today's news from overseas. The fact is that strong statistics can force the Fed to reconsider its views on monetary policy, and Jerome Powell can come to the conclusion that new easing is not required. In his last speech, Powell hinted at this: strong statistics and leveling of various risks to the economy – and a new rate cut is not possible. Thus, the forex market will closely follow the news from the US today.
Nearest support levels:
S1 – 1.1047
S2 – 1.0986
S3 – 1.0925
Nearest resistance levels:
R1 – 1.1108
R2 – 1.1169
R3 – 1.1230
Trading recommendations:
The EUR/USD currency pair started to adjust. On August 2, therefore, it is recommended to resume sales of the euro/dollar pair with the targets of 1.1047 and 1.0986 after the reversal of the Heiken Ashi indicator down.
It is recommended to buy the euro/dollar in small lots if the bulls manage to gain a foothold above the moving average line, with the first target Murray level of "3/8" - 1.1169.
In addition to the technical picture should also take into account the fundamental data and the time of their release.
Explanation of illustrations:
The upper linear regression channel – the blue line of the unidirectional movement.
The lower linear regression channel – the purple line of the unidirectional movement.
CCI – the blue line in the indicator window.
The moving average (20; smoothed) is the blue line on the price chart.
Murray levels – multi-colored horizontal stripes.
Heiken Ashi is an indicator that colors bars in blue or purple.
The material has been provided by InstaForex Company - www.instaforex.com