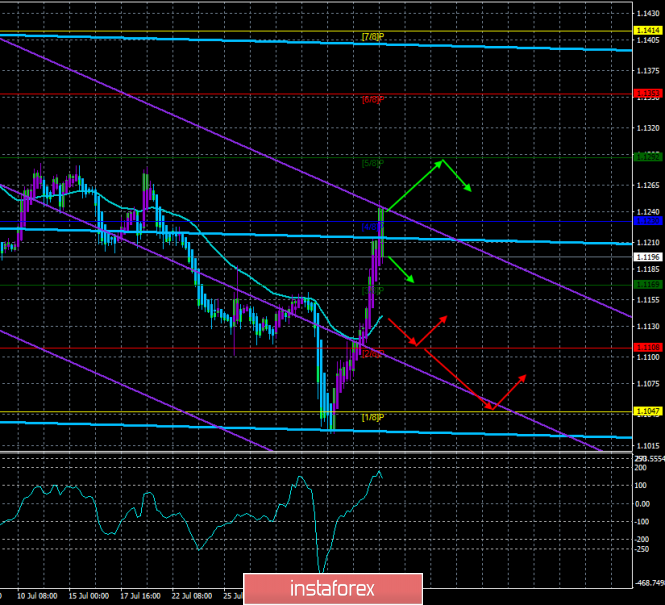
4-hour timeframe

Technical data:
The upper linear regression channel: direction – sideways.
The lower linear regression channel: direction – down.
The moving average (20; smoothed) – up.
CCI: 135.8122
On Monday, August 5, traders' attention was focused on data related to the escalation of the trade conflict between China and the States. First, Trump said he was raising $300 billion in duties on Chinese imports from September 1. To which China immediately responded with the collapse of its national currency, and also stopped buying agricultural products in the States. And now the question arises, does Trump still have strong cards in his hands? From September 1, all imports from China will be subject to duties. What is the next step? Increase in fees? And then? Sanctions? China, as everyone has understood, will not follow Trump's lead. China has a sufficient resource base and financial power to resist America. Of course, there will be losses for China's economy, but there will also be for the US economy. And the more damage is done to the States, the more likely that Trump will not be re-elected for a second term. And with the new president, which can be, for example, Joe Biden, it will be easier to negotiate simply because he is not Trump. Therefore, China is well aware that with the current difficult period, you just need to wait. Trump also crumbled in China's accusations that they "manipulate the exchange rate", and urged the Fed to pay attention to this point, hinting at the lack of aid in the trade war from the Fed. Well, the euro/dollar pair continues its technical correction, however, it could not consolidate above the previous local maximum, which gives reason to assume a new strengthening of the US currency.
Nearest support levels:
S1 – 1.1169
S2 – 1.1108
S3 – 1.1047
Nearest resistance levels:
R1 – 1,1230
R2 – 1.1292
R3 – 1.1353
Trading recommendations:
The EUR/USD currency pair continues its upward movement on August 6. Thus, it is recommended to buy the euro/dollar pair with the goals of 1.1230 and 1.1292 before the reversal of the Heiken Ashi indicator down.
It will be possible to sell the euro/dollar not earlier than the reverse consolidation of the pair below the moving average line with the goals of Murray levels of 1.1108 and 1.1047. In this case, the euro will return to the downward trend.
In addition to the technical picture should also take into account the fundamental data and the time of their release.
Explanation of illustrations:
The upper linear regression channel – the blue line of the unidirectional movement.
The lower linear regression channel – the purple line of the unidirectional movement.
CCI – the blue line in the indicator window.
The moving average (20; smoothed) - a blue line on the price chart.
Murray levels – multi-colored horizontal stripes.
Heiken Ashi is an indicator that colors bars in blue or purple.
The material has been provided by InstaForex Company - www.instaforex.com