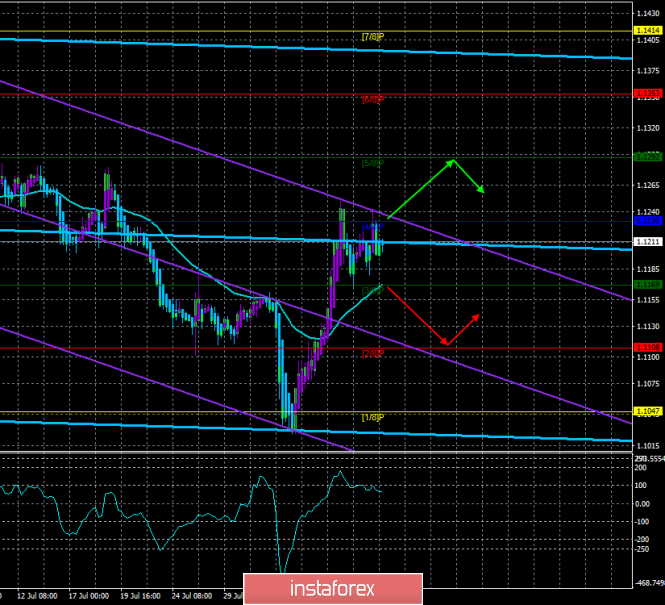
4-hour timeframe

Technical data:
The upper linear regression channel: direction – sideways.
The lower linear regression channel: direction – down.
The moving average (20; smoothed) – up.
CCI: 64.1338
On Wednesday, August 7, the EUR/USD pair ended with the repeated testing of Murray's level of "4/8" - 1.1230. It was an unsuccessful attempt to gain a foothold above again. This is the moment that we consider to be the most important and significant. Why? There is no fundamental background in recent days. There are no macroeconomic reports that can support the euro from the European Union. The possible reduction of the Fed rate at the next meeting is also not a reason for the momentary sales of the US currency. But technical factors still continue to indicate a downward trend. The fact is that the previous local maximum of 1.1283 has not been updated. Now, the euro/dollar has failed to overcome the level of 1.1230. On the face of the inability of the bulls to develop their success, which can lead to a return to the forex market of the bears with the subsequent interception of the initiative. The recent fashionable theme of "reducing the Fed rate", in our opinion, is too inflated, not least by Donald Trump, who criticizes the Fed almost every day. The day before, he said that the Fed cannot admit its mistake in too fast and strong tightening of monetary policy, and does not want to reduce the key rate as soon as possible. According to Trump, the problem is not even in the trade conflict with China, namely the Fed, which does not support Trump's policy in the international arena. However, "not a united bid." The American economy still continues to look much stronger than the European one, and in the long term, this is the main factor for traders.
Nearest support levels:
S1 – 1.1169
S2 – 1.1108
S3 – 1.1047
Nearest resistance levels:
R1 – 1.1230
R2 – 1.1292
R3 – 1.1353
Trading recommendations:
Since the euro/dollar pair is now above the moving average, it is recommended to wait for the reversal of the Heiken Ashi indicator to go up and buy the euro currency with a target of 1.1230.
Further purchases are possible only after the pair consolidates above the level of 1.1230 with the target of 1.1292.
In addition to the technical picture, fundamental data and the time of their release should also be taken into account.
Explanation of illustrations:
The upper linear regression channel – the blue line of the unidirectional movement.
The lower linear regression channel – the purple line of the unidirectional movement.
CCI – the blue line in the indicator window.
The moving average (20; smoothed) – blue line on the price chart.
Murray levels – multi-colored horizontal stripes.
Haiken Ashi is an indicator that colors bars in blue or purple.
The material has been provided by InstaForex Company - www.instaforex.com