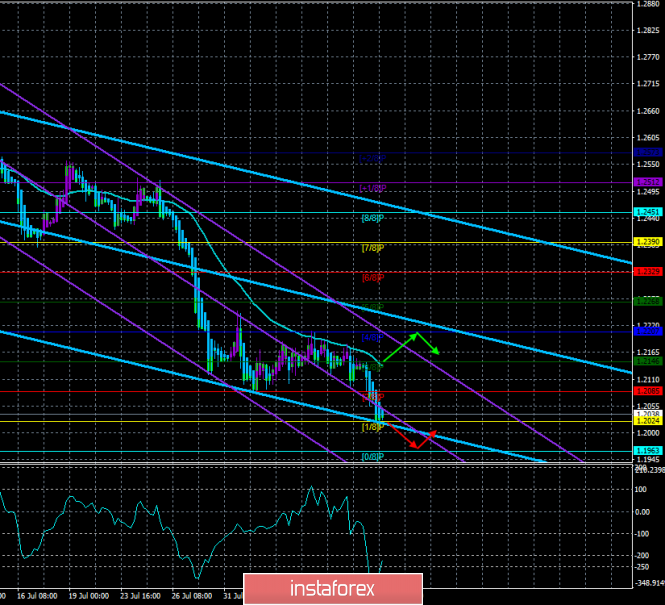
4-hour timeframe

Technical data:
The upper linear regression channel: direction – down.
The lower linear regression channel: direction – down.
The moving average (20; smoothed) – down.
CCI: -187.1588
UK macroeconomic data released on Friday turned out to be absolutely disappointing. Thus, the new fall of the British pound does not cause any questions and surprises. There has been no positive news regarding Brexit since Boris Johnson became the new prime minister. They have not been received before. Rumors have already begun to appear that Queen Elizabeth II of Great Britain is dissatisfied with current politicians who, in her opinion, "cannot rule the country." We are talking, of course, about the last three years, when David Cameron first initiated a referendum, and later, Theresa May was unable to bring Brexit to an end. Now, Boris Johnson can still withdraw Britain from the EU, but with what blood? We have repeatedly written about the possible consequences for the United Kingdom of disordered "divorce" with the European Union. There is only one thing to be repeated now, in the context of the movement of the pound sterling on the Forex currency market, traders have no reason to buy this currency, there was and is unlikely to appear if the next three months pass in preparation for the "hard" Brexit. The next important macroeconomic report from the UK will be a report on wages, which will be released tomorrow, August 13. We recall that prior to the fastening of the bulls above the moving average line, we are not even talking about buying pounds.
Nearest support levels:
S1 – 1.2024
S2 – 1.1963
S3 – 1.1902
Nearest resistance levels:
R1 – 1.2085
R2 – 1.2146
R3 – 1.2207
Trading recommendations:
The GBP/USD pair resumed its downward movement and continues it at this moment, as evidenced by the Heiken Ashi indicator. Thus, traders are advised to continue selling the pound with the targets of 1.2024 and 1.1963 until the reversal of the Heiken Ashi indicator to the top. Buying the pound/dollar pair is impractical.
In addition to the technical picture should also take into account the fundamental data and the time of their release.
Explanation of illustrations:
The upper linear regression channel – the blue line of the unidirectional movement.
The lower linear regression channel – the purple line of the unidirectional movement.
CCI – the blue line in the indicator regression window.
The moving average (20; smoothed) – blue line on the price chart.
Murray levels – multi-colored horizontal stripes.
Haiken Ashi is an indicator that colors bars in blue or purple.
The material has been provided by InstaForex Company - www.instaforex.com